Ternary Stability and LLE
This example demonstrates STABILITY and LLE calculations for the ternary system of water/ethanol/benzene to identify stable and unstable feed compositions and to trace the liquid-liquid phase boundary and tie lines.
In AMS2026, the python package ternary is available in amspython and can therefore be used directly for plotting ternary diagrams.
Python code for generating the input dataframes
The helper script TernaryStabilityLLE_common.py is used to generate the dataframes for the later calculations. In particular, it builds the ternary composition grid used for the STABILITY calculations and the composition scan used for the LLE calculations. The same script also contains the shared plotting routine used afterward by both examples.
[show/hide code]
from dataclasses import dataclass
from decimal import Decimal
from typing import List, Tuple

import matplotlib.pyplot as plt
import numpy as np
import pandas as pd


@dataclass
class Compound:
    name: str
    coskf: str


def build_simplex_grid_points(
    n_components: int,
    min_frac: float = 0.1,
    step: float = 0.1,
) -> List[Tuple[float, ...]]:
    min_dec = Decimal(str(min_frac))
    step_dec = Decimal(str(step))

    if n_components < 2:
        raise ValueError("n_components must be >= 2.")
    if min_dec <= 0 or step_dec <= 0:
        raise ValueError("min_frac and step must be > 0.")
    if n_components * min_dec > 1:
        raise ValueError("n_components * min_frac must be <= 1.")

    precision = max(-min_dec.as_tuple().exponent, -step_dec.as_tuple().exponent)
    scale = 10**precision
    total_units = scale
    min_units = int(min_dec * scale)
    step_units = int(step_dec * scale)

    if Decimal(min_units) / scale != min_dec:
        raise ValueError("min_frac is incompatible with the chosen decimal precision.")
    if Decimal(step_units) / scale != step_dec:
        raise ValueError("step is incompatible with the chosen decimal precision.")

    def recurse(remaining_components: int, remaining_units: int) -> List[Tuple[int, ...]]:
        if remaining_components == 1:
            if remaining_units >= min_units and remaining_units % step_units == 0:
                return [(remaining_units,)]
            return []

        points: List[Tuple[int, ...]] = []
        max_units = remaining_units - min_units * (remaining_components - 1)
        for units in range(min_units, max_units + 1, step_units):
            for tail in recurse(remaining_components - 1, remaining_units - units):
                points.append((units,) + tail)
        return points

    integer_points = recurse(n_components, total_units)
    return [tuple(float(x / scale) for x in point) for point in integer_points]


def build_ternary_grid_df(
    compounds: List[Compound],
    min_frac: float = 0.1,
    step: float = 0.1,
    temperature: float = 298.15,
    method: str = "COSMORS",
) -> pd.DataFrame:
    rows = []
    for mix_idx, point in enumerate(build_simplex_grid_points(3, min_frac=min_frac, step=step)):
        rows.append(
            {
                "Method": method,
                "Temperature": temperature,
                "ncomp": 3,
                "sys_idx": 0,
                "mix_idx": mix_idx,
                "s1": compounds[0].name,
                "s2": compounds[1].name,
                "s3": compounds[2].name,
                "x1": point[0],
                "x2": point[1],
                "x3": point[2],
                "unstable": pd.NA,
                "converged": pd.NA,
                "llle_detected": pd.NA,
                "xI1": pd.NA,
                "xI2": pd.NA,
                "xI3": pd.NA,
                "xII1": pd.NA,
                "xII2": pd.NA,
                "xII3": pd.NA,
            }
        )
    return pd.DataFrame(rows)


def build_ternary_lle_df(
    compounds: List[Compound],
    s1_ratio: float,
    s2_ratio: float,
    s3_min: float,
    s3_max: float,
    num_points: int,
    temperature: float = 298.15,
    method: str = "COSMORS",
) -> pd.DataFrame:
    total = 1.0

    if s1_ratio <= 0 or s2_ratio <= 0:
        raise ValueError("s1_ratio and s2_ratio must be > 0.")
    if num_points < 2:
        raise ValueError("num_points must be >= 2.")
    if s3_min < 0 or s3_max > total or s3_min > s3_max:
        raise ValueError("Require 0 <= s3_min <= s3_max <= 1.")

    ratio_total = s1_ratio + s2_ratio
    s1_share = s1_ratio / ratio_total
    s2_share = s2_ratio / ratio_total

    rows = []
    for mix_idx, x3 in enumerate(np.linspace(s3_min, s3_max, num_points)):
        remaining = total - x3
        x1 = remaining * s1_share
        x2 = remaining * s2_share

        if any(value < -1e-12 or value > total + 1e-12 for value in (x1, x2, x3)):
            raise ValueError("Generated composition is outside the [0, 1] interval.")

        rows.append(
            {
                "Method": method,
                "Temperature": temperature,
                "ncomp": 3,
                "sys_idx": 0,
                "mix_idx": mix_idx,
                "s1": compounds[0].name,
                "s2": compounds[1].name,
                "s3": compounds[2].name,
                "x1": float(x1),
                "x2": float(x2),
                "x3": float(x3),
                "unstable": pd.NA,
                "converged": pd.NA,
                "llle_detected": pd.NA,
                "xI1": pd.NA,
                "xI2": pd.NA,
                "xI3": pd.NA,
                "xII1": pd.NA,
                "xII2": pd.NA,
                "xII3": pd.NA,
            }
        )

    return pd.DataFrame(rows)


def _collect_feed_points(df: pd.DataFrame) -> List[Tuple[float, float, float]]:
    points: List[Tuple[float, float, float]] = []

    for row in df.itertuples():
        points.append((row.x1, row.x2, row.x3))

    return points


def _collect_phase_points(df: pd.DataFrame, prefix: str) -> List[Tuple[float, float, float]]:
    points: List[Tuple[float, float, float]] = []

    for row in df.itertuples():
        points.append((getattr(row, f"{prefix}1"), getattr(row, f"{prefix}2"), getattr(row, f"{prefix}3")))

    return points


def _collect_tie_lines(df: pd.DataFrame) -> List[Tuple[Tuple[float, float, float], Tuple[float, float, float]]]:
    tie_lines: List[Tuple[Tuple[float, float, float], Tuple[float, float, float]]] = []

    for row in df.itertuples():
        tie_lines.append(((row.xI1, row.xI2, row.xI3), (row.xII1, row.xII2, row.xII3)))

    return tie_lines


def configure_tax(tax, labels: List[str], title: str) -> None:
    fontsize = 10
    tax.boundary(linewidth=2.0)
    tax.gridlines(color="black", multiple=0.05, linewidth=0.5, alpha=0.4)
    tax.bottom_axis_label(f"{labels[0]}(1)", fontsize=fontsize, offset=0.1)
    tax.right_axis_label(f"{labels[1]}(2)", fontsize=fontsize, offset=0.1)
    tax.left_axis_label(f"{labels[2]}(3)", fontsize=fontsize, offset=0.1)
    tax.ticks(
        axis="lbr",
        multiple=0.1,
        linewidth=1,
        tick_formats="%.1f",
        offset=0.015,
        fontsize=fontsize,
    )
    tax.clear_matplotlib_ticks()
    raw_ax = tax.get_axes()
    for spine in raw_ax.spines.values():
        spine.set_visible(False)
    raw_ax.set_xticks([])
    raw_ax.set_yticks([])
    tax.set_title(title)


def plot_demo_figure(df_stability: pd.DataFrame, df_lle: pd.DataFrame):
    import ternary

    labels = [
        str(df_stability.iloc[0]["s1"]),
        str(df_stability.iloc[0]["s2"]),
        str(df_stability.iloc[0]["s3"]),
    ]
    fig, axes = plt.subplots(1, 2, figsize=(13, 5.5))

    _, tax_stab = ternary.figure(scale=1.0, ax=axes[0])
    configure_tax(tax_stab, labels, "STABILITY: stable vs unstable grid points")

    stable_df = df_stability.loc[~df_stability["unstable"].fillna(False).astype(bool)].copy()
    unstable_df = df_stability.loc[df_stability["unstable"].fillna(False).astype(bool)].copy()

    stable_points = _collect_feed_points(stable_df)
    unstable_points = _collect_feed_points(unstable_df)

    if stable_points:
        tax_stab.scatter(
            stable_points,
            s=42,
            marker="o",
            facecolors="none",
            edgecolors="#1b5e20",
            linewidths=1.2,
            label="Stable feed",
        )
    if unstable_points:
        tax_stab.scatter(
            unstable_points,
            s=42,
            marker="o",
            facecolors="none",
            edgecolors="#c04a00",
            linewidths=1.2,
            label="Unstable feed",
        )

    _, tax_lle = ternary.figure(scale=1.0, ax=axes[1])
    configure_tax(tax_lle, labels, "LLE: phase boundary")

    lle_plot_df = df_lle.loc[
        df_lle["converged"].fillna(False).astype(bool) & ~df_lle["llle_detected"].fillna(False).astype(bool)
    ].copy()
    if lle_plot_df.empty:
        raise ValueError("No converged non-LLLE LLE rows are available for this ternary system.")

    feed_points = _collect_feed_points(lle_plot_df)
    phase_i_points = _collect_phase_points(lle_plot_df, "xI")
    phase_ii_points = _collect_phase_points(lle_plot_df, "xII")
    tie_lines = _collect_tie_lines(lle_plot_df)

    tax_lle.scatter(
        feed_points,
        s=44,
        marker="^",
        facecolors="none",
        edgecolors="black",
        linewidths=1.0,
        label="Feed",
    )
    tax_lle.scatter(
        phase_i_points,
        s=34,
        marker="o",
        facecolors="none",
        edgecolors="tab:blue",
        linewidths=1.2,
        label="Phase I boundary",
    )
    tax_lle.scatter(
        phase_ii_points,
        s=34,
        marker="o",
        facecolors="none",
        edgecolors="tab:orange",
        linewidths=1.2,
        label="Phase II boundary",
    )

    for index, (point_i, point_ii) in enumerate(tie_lines):
        tax_lle.line(
            point_i,
            point_ii,
            color="0.65",
            linewidth=0.9,
            alpha=0.85,
            label="Tie line" if index == 0 else None,
        )

    for tax in (tax_stab, tax_lle):
        handles, _ = tax.get_axes().get_legend_handles_labels()
        if handles:
            tax.legend(loc="upper right", frameon=False)
        if hasattr(tax, "_redraw_labels"):
            tax._redraw_labels()

    fig.tight_layout()
    return fig
Python code using pyCRS
In the first script example, the pyCRS.Database and pyCRS.CRSManager modules are used to build a small COSKF database and run the STABILITY and LLE calculations in batch.
[show/hide code]
import os
from pathlib import Path

import matplotlib.pyplot as plt
from pyCRS.CRSManager import CRSSystem
from pyCRS.Database import COSKFDatabase
from scm.plams import CRSJob, JobRunner, config
from TernaryStabilityLLE_common import Compound, build_ternary_grid_df, build_ternary_lle_df, plot_demo_figure

TEMPERATURE = 298.15
METHOD = "COSMORS"
MAX_JOBS = 8
SOLVENTS = [
    Compound("Water", "Water.coskf"),
    Compound("Ethanol", "Ethanol.coskf"),
    Compound("Benzene", "Benzene.coskf"),
]
DB_NAME = "ternary_stability_lle_demo.db"
DATABASE_PATH = CRSJob.database()
IMAGE_NAME = "TernaryStabilityLLE.png"


def prepare_database(db_name, compounds):
    db_path = Path(db_name)
    if db_path.exists():
        db_path.unlink()

    db = COSKFDatabase(db_name)
    for compound in compounds:
        coskf_path = os.path.join(DATABASE_PATH, compound.coskf)
        if not os.path.exists(coskf_path):
            raise FileNotFoundError(f"COSKF file not found: {coskf_path}")
        db.add_compound(coskf_file=compound.coskf, name=compound.name, coskf_path=DATABASE_PATH)

    return db


def run_demo(df_stability, df_lle, db):
    cal_stability = CRSSystem()
    for _, row in df_stability.iterrows():
        mixture = {row["s1"]: row["x1"], row["s2"]: row["x2"], row["s3"]: row["x3"]}
        cal_stability.add_Mixture(
            mixture,
            temperature=row["Temperature"],
            problem_type="STABILITY",
            database=db,
            method=row["Method"],
            jobname=f"STABILITY_{row['mix_idx']}",
        )
    cal_stability.runCRSJob()

    for index, out in zip(df_stability.index, cal_stability.outputs):
        results = out.get_results()
        df_stability.loc[index, "unstable"] = bool(results.get("unstable", False))

    cal_lle = CRSSystem()
    for _, row in df_lle.iterrows():
        mixture = {row["s1"]: row["x1"], row["s2"]: row["x2"], row["s3"]: row["x3"]}
        cal_lle.add_Mixture(
            mixture,
            temperature=row["Temperature"],
            problem_type="LLE",
            database=db,
            method=row["Method"],
            jobname=f"LLE_{row['mix_idx']}",
        )
    cal_lle.runCRSJob()

    for index, out in zip(df_lle.index, cal_lle.outputs):
        results = out.get_results()
        converged = bool(results.get("converged", False))
        llle_detected = bool(results.get("llle_detected", False))
        df_lle.loc[index, "converged"] = converged
        df_lle.loc[index, "llle_detected"] = llle_detected
        if converged:
            x_i = results.get("xI")
            x_ii = results.get("xII")
            for component_index in range(3):
                component_number = component_index + 1
                if x_i is not None:
                    df_lle.loc[index, f"xI{component_number}"] = x_i[component_index][0]
                if x_ii is not None:
                    df_lle.loc[index, f"xII{component_number}"] = x_ii[component_index][0]

    return df_stability, df_lle


db = prepare_database(DB_NAME, SOLVENTS)

config.default_jobrunner = JobRunner(parallel=True, maxjobs=MAX_JOBS)
config.job.runscript.nproc = 1
config.log.stdout = 1

df_stability = build_ternary_grid_df(SOLVENTS, min_frac=0.1, step=0.1, temperature=TEMPERATURE, method=METHOD)
df_lle = build_ternary_lle_df(
    SOLVENTS,
    s1_ratio=1.0,
    s2_ratio=1.0,
    s3_min=0.1,
    s3_max=0.9,
    num_points=9,
    temperature=TEMPERATURE,
    method=METHOD,
)

df_stability, df_lle = run_demo(df_stability, df_lle, db)
fig = plot_demo_figure(df_stability, df_lle)

print(df_stability[["mix_idx", "x1", "x2", "x3", "unstable"]])
print(df_lle[["mix_idx", "x1", "x2", "x3", "converged", "llle_detected", "xI1", "xI2", "xI3", "xII1", "xII2", "xII3"]])
fig.savefig(IMAGE_NAME, dpi=200, bbox_inches="tight")
plt.show()
This code produces the following output:
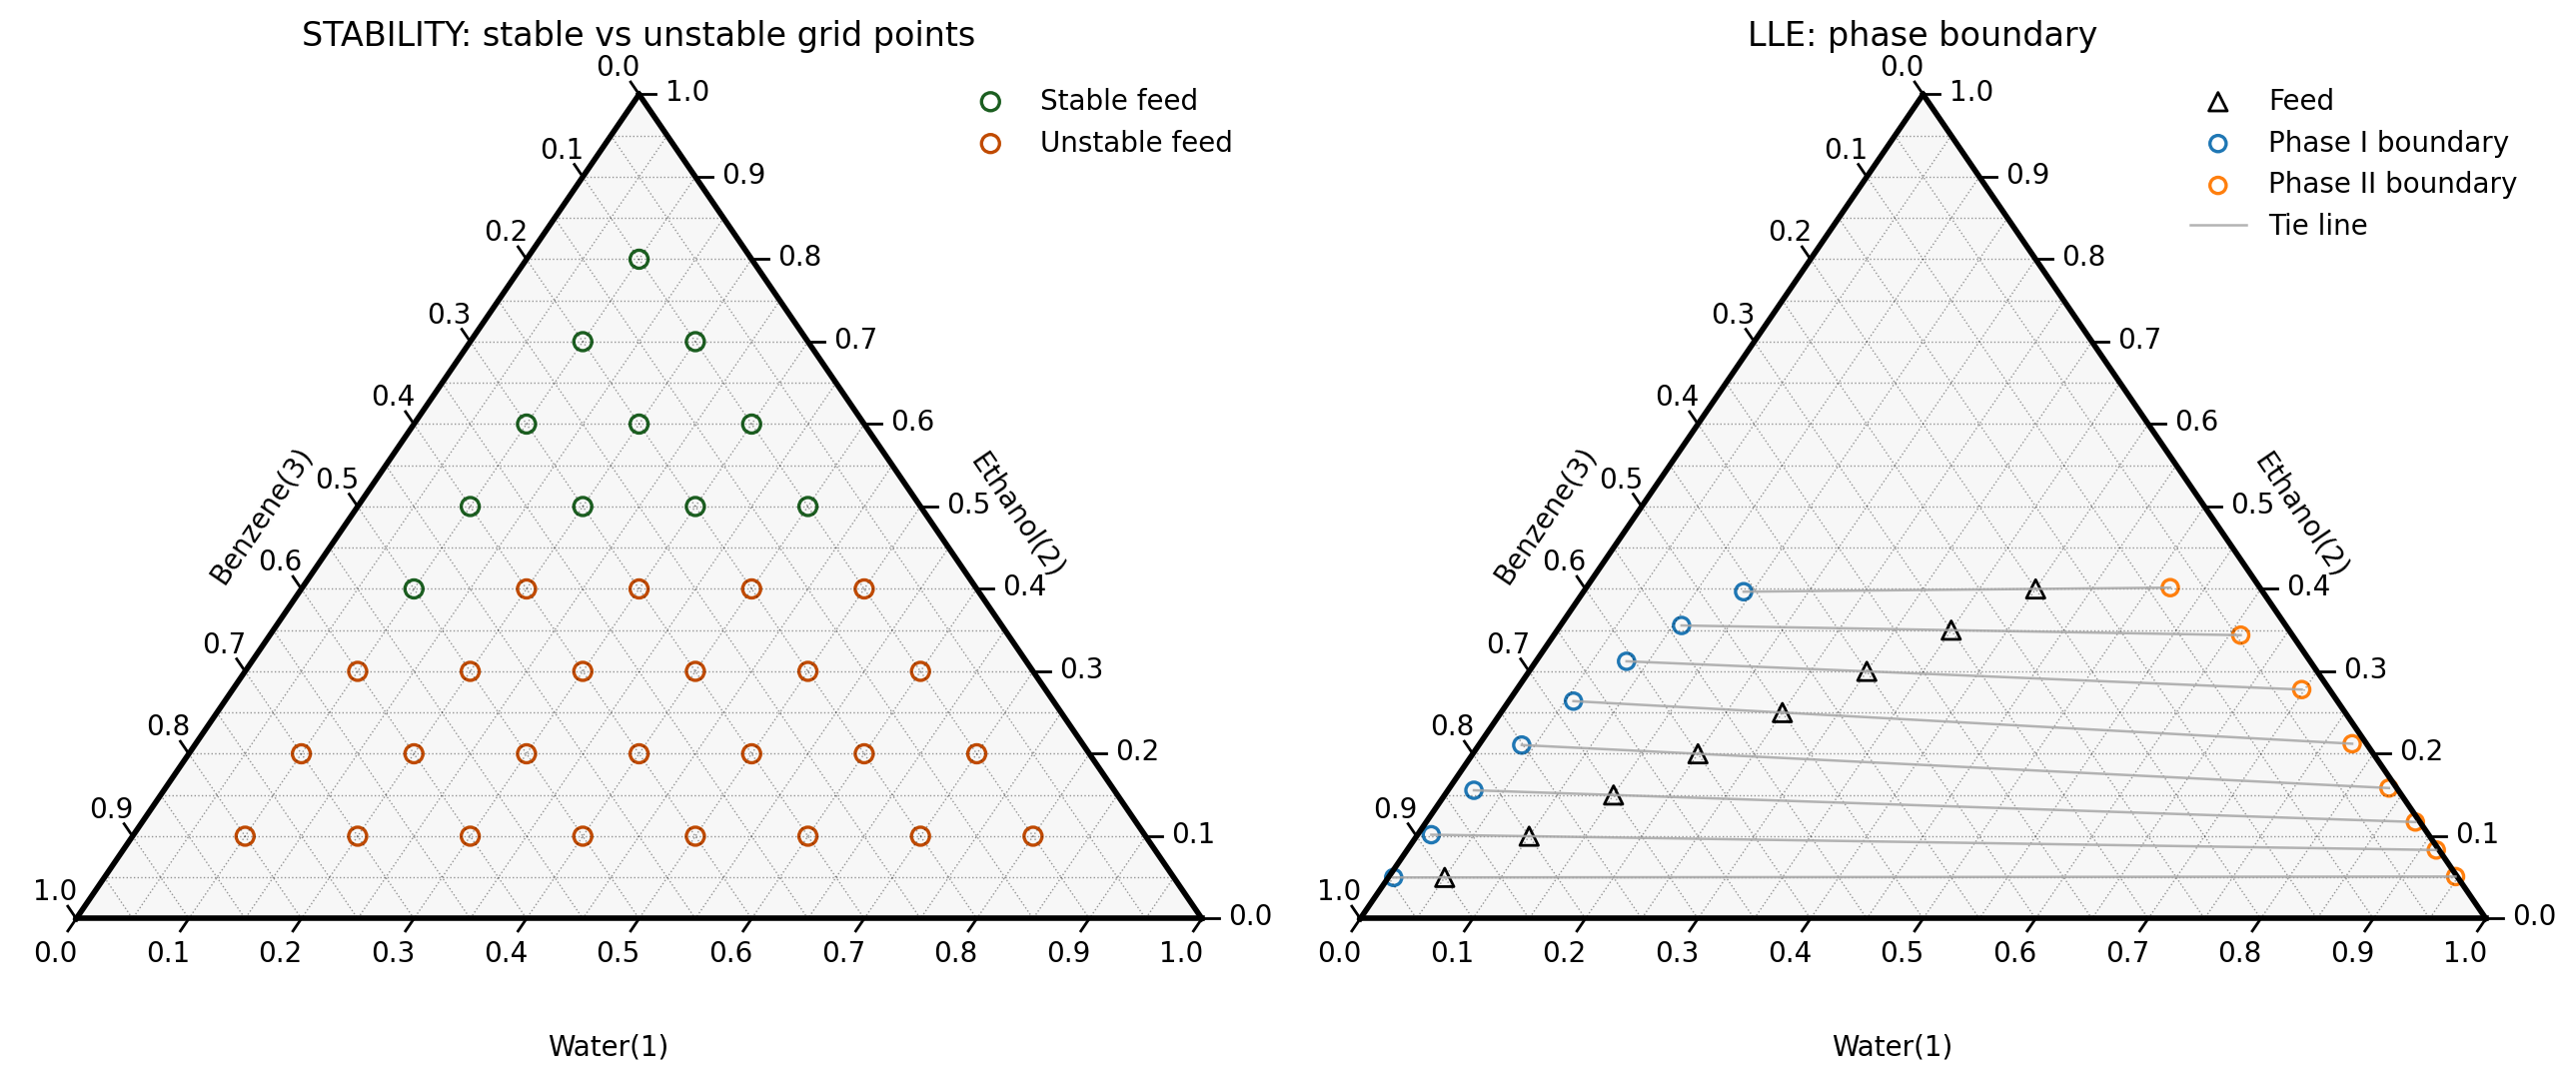
Fig. 8 Ternary stability grid and LLE phase-boundary plot for the water/ethanol/benzene system at 298.15 K.
Python code using PLAMS
In the second script example, the same workflow is set up directly with PLAMS input setting blocks for each CRSJob. This is useful when the calculation setup needs to stay close to the underlying COSMO-RS input.
[show/hide code]
import os

import matplotlib.pyplot as plt
from scm.plams import CRSJob, JobRunner, Settings, config
from TernaryStabilityLLE_common import Compound, build_ternary_grid_df, build_ternary_lle_df, plot_demo_figure

TEMPERATURE = 298.15
METHOD = "COSMORS"
MAX_JOBS = 8
SOLVENTS = [
    Compound("Water", "Water.coskf"),
    Compound("Ethanol", "Ethanol.coskf"),
    Compound("Benzene", "Benzene.coskf"),
]
DATABASE_PATH = CRSJob.database()
IMAGE_NAME = "TernaryStabilityLLE.png"


def ensure_compound_files(compounds):
    for compound in compounds:
        coskf_path = os.path.join(DATABASE_PATH, compound.coskf)
        if not os.path.exists(coskf_path):
            raise FileNotFoundError(f"COSKF file not found: {coskf_path}")


def run_demo(df_stability, df_lle):
    outputs = []
    for _, row in df_stability.iterrows():
        settings = Settings()
        settings.input.compound = []
        for component_index, compound in enumerate(SOLVENTS, start=1):
            block = Settings()
            block._h = os.path.join(DATABASE_PATH, compound.coskf)
            block.frac1 = float(row[f"x{component_index}"])
            block.name = compound.name.lower()
            settings.input.compound.append(block)

        settings.input.method = row["Method"]
        settings.input.property._h = "STABILITY"
        settings.input.temperature = row["Temperature"]

        job = CRSJob(settings=settings, name=f"STABILITY_{row['mix_idx']}")
        outputs.append(job.run())

    for index, out in zip(df_stability.index, outputs):
        results = out.get_results()
        df_stability.loc[index, "unstable"] = bool(results.get("unstable", False))

    outputs = []
    for _, row in df_lle.iterrows():
        settings = Settings()
        settings.input.compound = []
        for component_index, compound in enumerate(SOLVENTS, start=1):
            block = Settings()
            block._h = os.path.join(DATABASE_PATH, compound.coskf)
            block.frac1 = float(row[f"x{component_index}"])
            block.name = compound.name.lower()
            settings.input.compound.append(block)

        settings.input.method = row["Method"]
        settings.input.property._h = "LLE"
        settings.input.temperature = row["Temperature"]

        job = CRSJob(settings=settings, name=f"LLE_{row['mix_idx']}")
        outputs.append(job.run())

    for index, out in zip(df_lle.index, outputs):
        results = out.get_results()
        converged = bool(results.get("converged", False))
        llle_detected = bool(results.get("llle_detected", False))
        df_lle.loc[index, "converged"] = converged
        df_lle.loc[index, "llle_detected"] = llle_detected
        if converged:
            x_i = results.get("xI")
            x_ii = results.get("xII")
            for component_index in range(3):
                component_number = component_index + 1
                if x_i is not None:
                    df_lle.loc[index, f"xI{component_number}"] = x_i[component_index][0]
                if x_ii is not None:
                    df_lle.loc[index, f"xII{component_number}"] = x_ii[component_index][0]

    return df_stability, df_lle


ensure_compound_files(SOLVENTS)

config.default_jobrunner = JobRunner(parallel=True, maxjobs=MAX_JOBS)
config.job.runscript.nproc = 1
config.log.stdout = 1

df_stability = build_ternary_grid_df(SOLVENTS, min_frac=0.1, step=0.1, temperature=TEMPERATURE, method=METHOD)
df_lle = build_ternary_lle_df(
    SOLVENTS,
    s1_ratio=1.0,
    s2_ratio=1.0,
    s3_min=0.1,
    s3_max=0.9,
    num_points=9,
    temperature=TEMPERATURE,
    method=METHOD,
)

df_stability, df_lle = run_demo(df_stability, df_lle)
fig = plot_demo_figure(df_stability, df_lle)

print(df_stability[["mix_idx", "x1", "x2", "x3", "unstable"]])
print(df_lle[["mix_idx", "x1", "x2", "x3", "converged", "llle_detected", "xI1", "xI2", "xI3", "xII1", "xII2", "xII3"]])
fig.savefig(IMAGE_NAME, dpi=200, bbox_inches="tight")
plt.show()
This script generates the same ternary figure as shown above.
Download scripts
Download TernaryStabilityLLE_common.py