Battery Cathodes: Intercalation Potential and Volume Change
Note: This tutorial is intended for AMS2026 with access to the UMA-S-1.2-OMat machine learning potential.
This tutorial will teach you how to:
Optimize the lithiated and delithiated crystal structures of LiFePO4.
Compute the intercalation potential from the two total energies.
Compute the relative volume change upon delithiation.
Consider how the workflow can be adapted to explore doped cathodes as well as sodium analogues.
If you follow this tutorial, you will be able to calculate the properties of the materials cited in Ref. [1].
Structure |
Expt. IP |
Calc. IP |
Expt. VC |
Calc. VC |
|---|---|---|---|---|
LiCoO2 |
4.10 |
3.926 |
-7.958 |
-2.102 |
LiNiO2 |
3.90 |
4.014 |
-9.422 |
-8.461 |
LiTiS2 |
2.10 |
1.972 |
-10.605 |
-8.849 |
LiMn2O4 |
4.10 |
3.913 |
-5.051 |
-5.939 |
LiMnPO4 |
4.10 |
3.872 |
-9.046 |
-8.534 |
LiFePO4 |
3.50 |
3.573 |
-6.534 |
-5.764 |
LiCoPO4 |
4.80 |
4.412 |
-1.846 |
-4.310 |
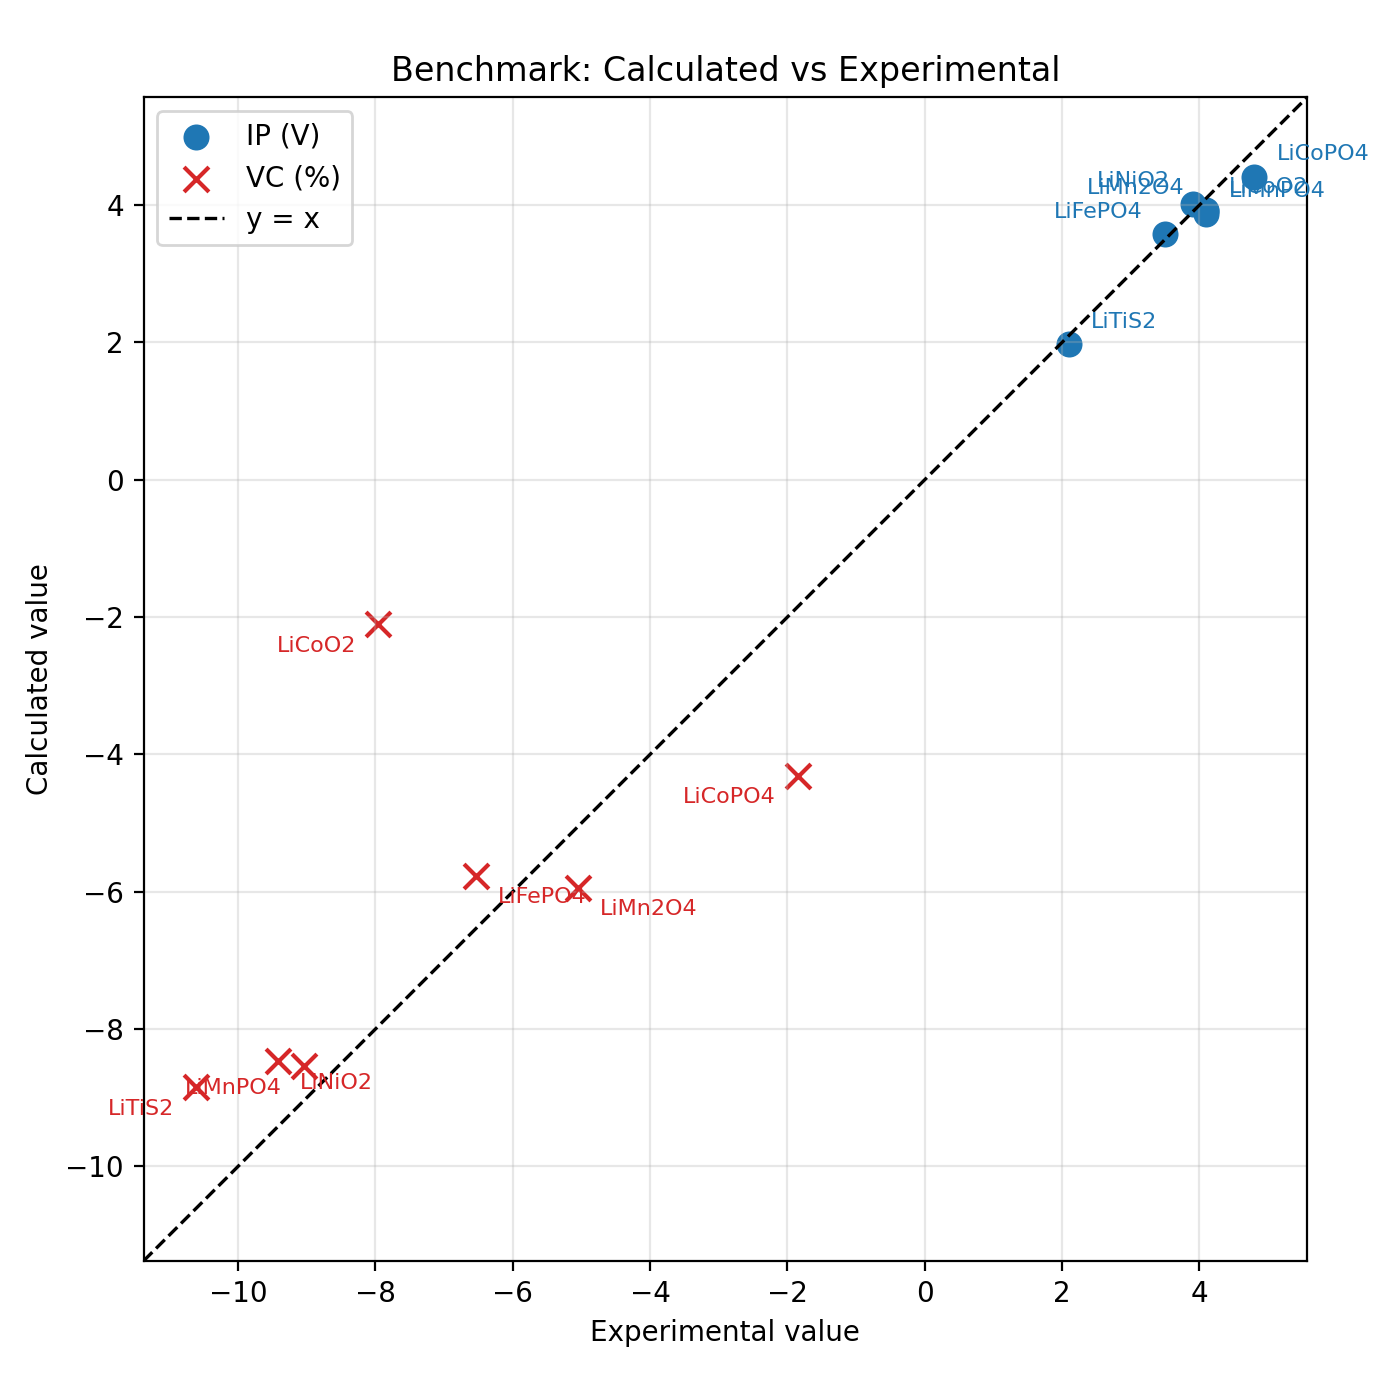
Fig. 27 Calculated versus experimental benchmark values for the materials in Table II and Table IV of Ref. [1]. Blue circles show the intercalation potential (IP, in V vs. Li/Li+) and red crosses show the relative volume change upon delithiation (VC, in %). The dashed diagonal corresponds to y = x.
Note
Overall, UMA-S-1.2-OMat reproduces these properties very well, with noticeable deviations observed only for the Co-based materials.
Introduction
Olivine phosphate materials are widely studied as battery cathodes because they can combine good stability with high operating voltage. In this tutorial, we use LiFePO4 as a starting point and evaluate two simple descriptors for cathode performance:
the intercalation potential
the volume change upon charging
The basic idea is to optimize two crystal structures:
the lithiated material LiFePO4
the delithiated material FePO4
From these calculations, you can estimate the average lithium intercalation potential and the relative volume change.
In practice, you should use a consistent reference energy for lithium metal when evaluating the voltage.
The volume change is computed from the optimized cell volumes:
You should therefore review 10 Ways to Get the Energy and Other Properties. Looking at the output of a geometry optimization job, you will find at the end the Energy (hartree) and right above the Unit cell volume (angstrom^3) (when the lattice is optimized), which can be used to extract the relevant data for this tutorial.
Tip
We recommend creating a table to store the total energies and volumes of each calculation you perform below.
For comparison, the experimental values for LiFePO4 and FePO4 from Tables II and IV of Ref. [1] are:
Property |
Experimental value |
|---|---|
LiFePO4 volume (Å3 /f.u.) |
72.85 |
FePO4 volume (Å3 /f.u.) |
68.09 |
Relative volume change upon delithiation (%) |
-6.534 |
Average intercalation potential (V vs. Li/Li+) |
3.5 |
This tutorial focuses on the GUI workflow. A companion Jupyter notebook can be used for the same workflow in Python.
Part A: LiFePO4
Part A focuses on pristine LiFePO4. You will first calculate the lithium reference energy needed to compute the intercalation potential.
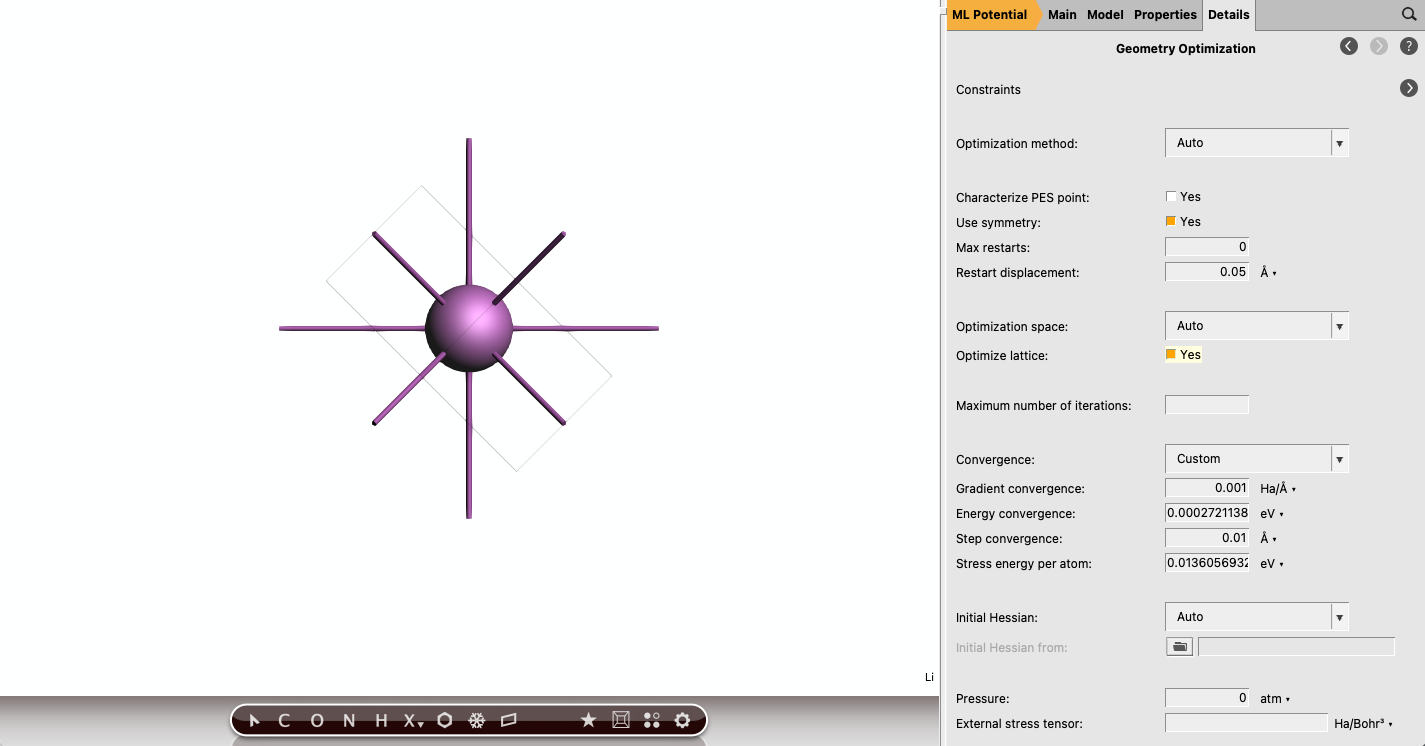
Setting the Lithium Reference Energy
Build and optimize bulk lithium in AMSinput.
 →
→ 
Li_bcc_optWe found a lithium reference energy of E(Li) = -0.070836 Ha per atom.
Set up and run the LiFePO4 calculations
You will now optimize the fully lithiated structure and then create and optimize the delithiated structure.
Set up the geometry optimization for LiFePO4 in AMSinput.
LiFePO4.cif →
→ LiFePO4_opt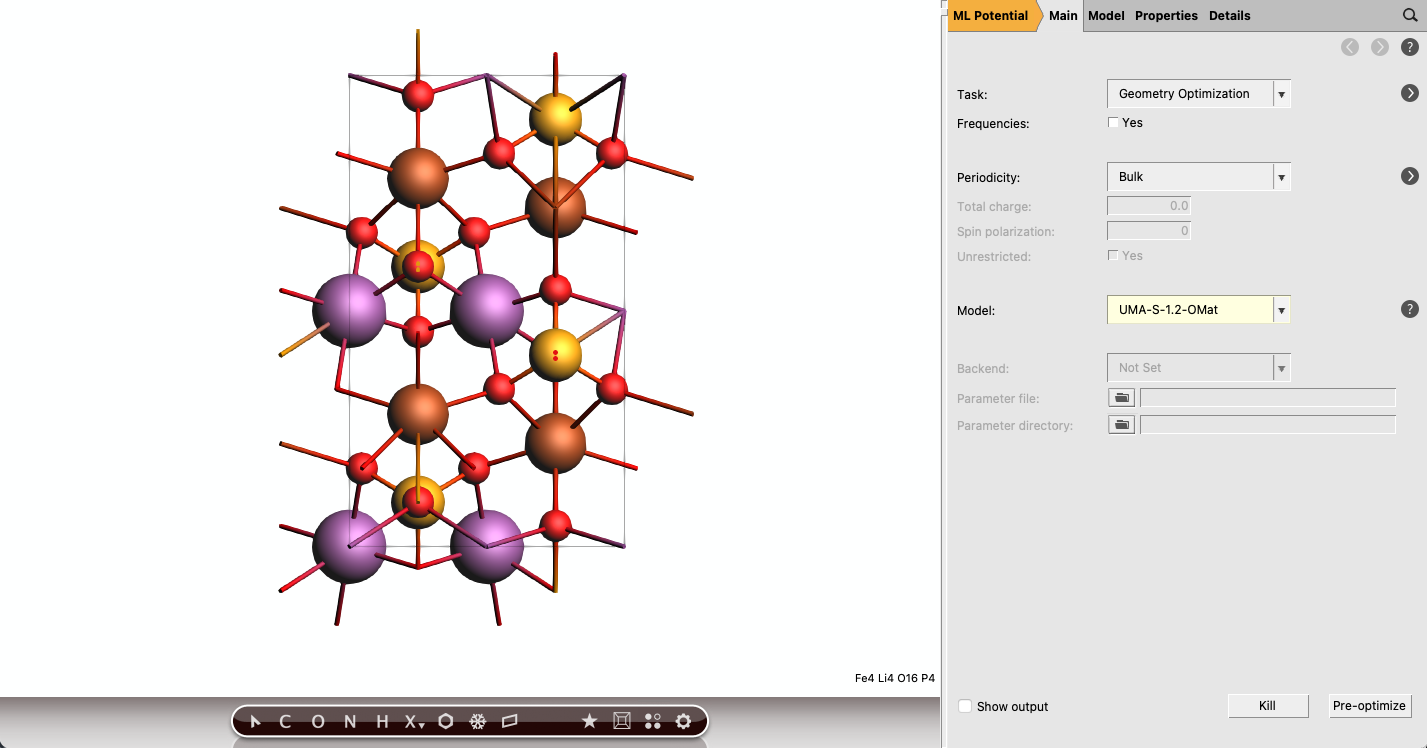
Next, create the delithiated structure FePO4.
LiFePO4 input, or continue from the existing setupFePO4_opt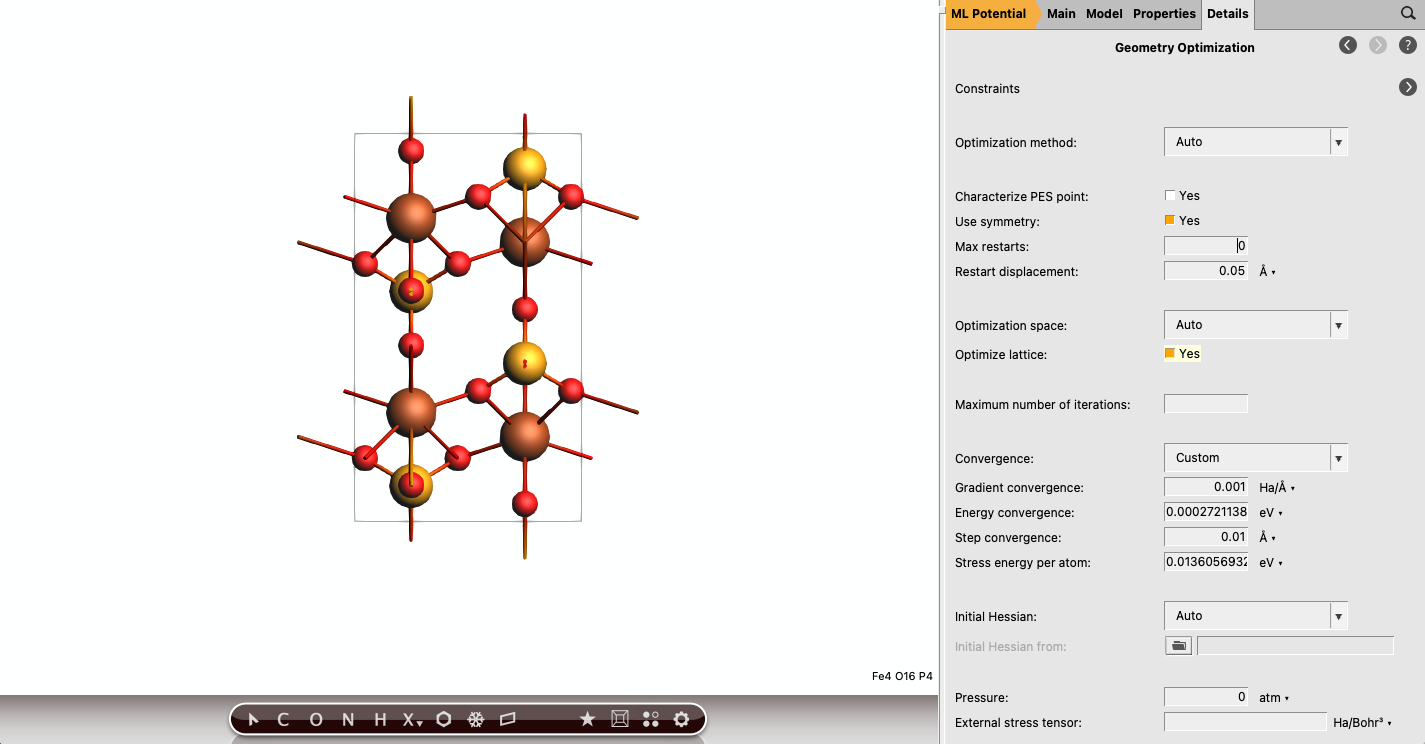
Analyzing the Results
After both jobs have finished, collect the total energies and optimized cell volumes. A compact way to organize the results is shown below.
Calculation |
Total energy (Ha) |
Cell volume (Å 3) |
Comment |
|---|---|---|---|
Li metal |
-0.070836 per atom |
40.53114 |
bcc Li reference |
LiFePO4 |
-7.21135362 |
293.76580 |
optimized lithiated structure |
FePO4 |
-6.40276118 |
276.83367 |
optimized delithiated structure |
Intercalation Potential and Volume Change
Use the total energies and volumes of LiFePO4 and FePO4 together with a lithium metal reference energy to compute the average intercalation potential and volume change.
For the reaction
the benchmark calculation reported above gives the following LiFePO4 values:
Property |
Value |
|---|---|
Average intercalation potential |
3.573 V |
Relative volume change |
-5.764 % |
Experimental intercalation potential |
3.5 V |
Experimental volume change |
-6.534 % |
You can repeat the workflow with other cathode materials to obtain Table 9.
Part B: Doped Material
In this part, replace a fraction of Fe by a different element and evaluate whether the modified material offers an improved trade-off between voltage and volume change.
Consider a composition of the form
where X can be chosen from:
Mg
Ti
Nb
Si
Choose one dopant and repeat the same workflow as in Part A.
The goal is to identify a material with
a small absolute volume change
a high intercalation potential
potentially improved energy density relative to LiFePO4
Part C: Sodium Analogue
As a final exploratory exercise, adapt the same workflow from lithium to sodium.
Possible questions to investigate:
How do the optimized lattice parameters change when Li is replaced by Na?
How does the intercalation potential compare to the lithium system?
Is the volume change larger or smaller than in the lithium case?
This part can be carried out by preparing the corresponding sodium structure and repeating the same geometry optimization and analysis procedure.
Summary
In this tutorial, you learned how to use AMSinput with a machine learning potential to:
optimize lithiated and delithiated cathode structures
extract total energies and cell volumes from the AMS GUI
compute the average intercalation potential
compute the relative volume change
compare pristine and doped phosphate cathodes
The same approach can be extended to other battery materials and to larger screening studies.