Lattice
The Lattice class defines the lattice structure on which species can bind, diffuse and react. There are several ways to specify the lattice structure. They are defined in a correspondence one-to-one with the conventions used in the Zacros’ input files. See the API section below for a detailed description of these three ways: 1) Default Lattices, 2) Unit-Cell-Defined Periodic Lattices, and 3) Explicitly Defined Custom Lattices.
Following our example (see use case system), we just need a single-site lattice with
a coordination number of 3, a lattice constant equal to 1.0, and a modest number of copies of the unit cell 10x3:
1 2 3 4 5 6 7 | # Lattice setup
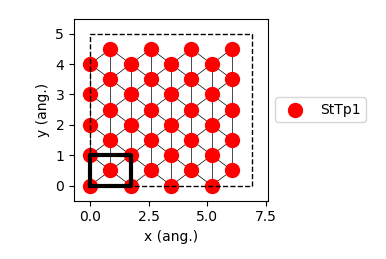
lat = pz.Lattice( lattice_type=pz.Lattice.TRIANGULAR,
lattice_constant=1.0, repeat_cell=[10,3] )
print(lat)
lattice.plot()
|
The previous lines produce the following output:
lattice default_choice
triangular_periodic 1.0 10 3
end_lattice
In addition to the capabilities of building lattices, pyZacros also offers a way to visualize them by calling
the function plot(). e.g., see line 7 of the script above. This line produces the following figure:

API
-
class
Lattice(**kwargs)¶ Lattice class that defines the lattice structure on which species can bind, diffuse and react. As in Zacros’ original input files, there are three different ways of specifying a lattice structure. Below we describe these three ways with the corresponding parameters as well with examples of use.
Default Lattices:
lattice_type– Define the lattice to use. Possible options are:Lattice.TRIANGULAR: Specifies a lattice with coordination number 3. The unit cell is not the primitive cell. The obtained unit cell is a rectangular cell containing 4 sites.Lattice.RECTANGULAR: Specifies a lattice with coordination number 4. The unit cell contains 1 site. The unit cell is the primitive cell.Lattice.HEXAGONAL: Specifies a lattice with coordination number 6. The unit cell is not the primitive cell. The obtained unit cell is a rectangular cell containing 2 sites.
lattice_constant– Defines the lattice constant (in angstrom).repeat_cell– The number of repetitions of the unit cell in the horizontal and vertical.
Example:
lattice = Lattice( lattice_type=Lattice.HEXAGONAL, lattice_constant=1.0, repeat_cell=[4,5] )
Unit-Cell-Defined Periodic Lattices:
cell_vectors– Define the unit vectors. e.g.[[0.123, 0.000],[1.234,1.234]]repeat_cell– The number of repetitions of the unit cell in the directions of unit vectors. e.g.(10,10)site_types– The names of the different site types. e.g.[ "cn2", "br42", "cn2" ]site_coordinates– Pairs of real numbers specifying the “fractional coordinates” of each site in the unit cell. e.g.[ (0.123,0.894), (0.456,0.123) ]neighboring_structure– Defines a neighboring structure block. e.g.[ ((0,0),Lattice.NORTH), ((0,1),Lattice.NORTHEAST) ]
Example:
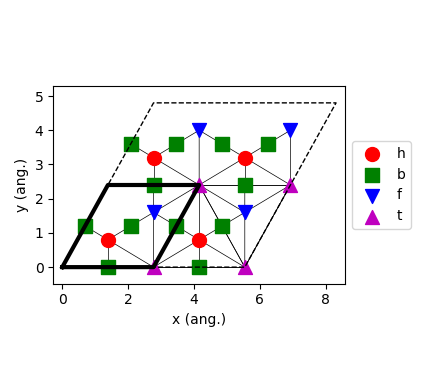
lattice = Lattice( cell_vectors=[[2.77185866, 0.00000000],[1.38592933, 2.40050002]],
                   repeat_cell=[2, 2],
                   site_types=["b", "h", "b", "b", "f", "t"],
                   site_coordinates=[[0.00001, 0.49999],
                                     [0.33333, 0.33333],
                                     [0.49999, 0.00001],
                                     [0.49999, 0.49999],
                                     [0.66667, 0.66667],
                                     [0.99999, 0.00001]],
                   neighboring_structure=[ [(0,1), Lattice.SELF],
                                           [(1,2), Lattice.SELF],
                                           [(1,3), Lattice.SELF],
                                           [(3,4), Lattice.SELF],
                                           [(4,2), Lattice.NORTH],
                                           [(4,0), Lattice.EAST],
                                           [(5,5), Lattice.NORTH],
                                           [(5,5), Lattice.EAST],
                                           [(5,4), Lattice.SELF],
                                           [(5,1), Lattice.SELF],
                                           [(5,1), Lattice.EAST],
                                           [(5,4), Lattice.SOUTHEAST],
                                           [(5,1), Lattice.SOUTHEAST],
                                           [(4,5), Lattice.NORTH],
                                           [(5,5), Lattice.SOUTHEAST] ] )
Explicitly Defined Custom Lattices:
site_types– The names of the different site types. e.g.[ "cn2", "br42" ]site_coordinates– Pairs of real numbers specifying the “fractional coordinates” of each site in the unit cell. e.g.[ (0.123,0.894), (0.456,0.123) ]nearest_neighbors– Defines the neighboring structure. e.g.[ (2,6), (2,4,7,8) ]cell_vectors– Define the unit vectors. Optional
Example:
lattice = Lattice( site_types=["cn2", "br42", "cn4", "br42", "cn2", "br42",
                                  "br44", "br44", "br42", "cn4", "br44", "cn4",
                                  "br42", "br42", "cn2"],
                   site_coordinates=[[0.0000e+0, 0.0000e+0],
                                     [1.4425e+0, 0.0000e+0],
                                     [2.8850e+0, 0.0000e+0],
                                     [4.3275e+0, 0.0000e+0],
                                     [5.7700e+0, 0.0000e+0],
                                     [7.2125e-1, 1.2492e+0],
                                     [2.1637e+0, 1.2492e+0],
                                     [3.6062e+0, 1.2492e+0],
                                     [5.0487e+0, 1.2492e+0],
                                     [1.4425e+0, 2.4985e+0],
                                     [2.8850e+0, 2.4985e+0],
                                     [4.3275e+0, 2.4985e+0],
                                     [2.1637e+0, 3.7477e+0],
                                     [3.6062e+0, 3.7477e+0],
                                     [2.8850e+0, 4.9970e+0]],
                   nearest_neighbors=[[ 1,  5],
                                      [ 0,  2],
                                      [ 1,  3,  6, 7],
                                      [ 2,  4],
                                      [ 3,  8],
                                      [ 0,  9],
                                      [ 2,  9],
                                      [ 2, 11],
                                      [ 4, 11],
                                      [ 5,  6, 10, 12],
                                      [ 9, 11],
                                      [ 7,  8, 10, 13],
                                      [ 9, 14],
                                      [11, 14],
                                      [12, 13]] )

-
plot(pause=-1, show=True, color=None, ax=None, close=False, show_sites_ids=False, file_name=None)¶ Uses Matplotlib to visualize the lattice. Be sure that Matplotlib is installed in your system; otherwise, the function does nothing.
pause– After showing the figure, it will waitpause-seconds before refreshing. This can be used for crude animation.show– Enables showing the figure on the screen.color– Uses the same color for both binding sites and connections; e.g. ‘k’. See matplotlib.colors.ax– The axes of the plot. It contains most of the figure elements: Axis, Tick, Line2D, Text, Polygon, etc., and sets the coordinate system. See matplotlib.axes.close– Closes the figure window after pause time.show_sites_ids– Shows the binding sites id on the figure.file_name– Saves the figure to the filefile_name. The format is inferred from the extension, and by default,.pngis used.
-
number_of_sites()¶ Returns the total number of sites
-
site_types_set()¶ Returns the set of the sites types
-
set_repeat_cell(repeat_cell)¶ Set the parameter repeat_cell and update all internal information
repeat_cell– The number of repetitions of the unit cell in the directions of unit vectors. e.g.(10,10)
-
replace_site_types_names(site_types_old, site_types_new)¶ Replaces the site types names
site_types_old– List of strings containing the old site_types to be replacedsite_types_new– List of strings containing the new site_types which would replace old site_types_old.