Introduction
What is pyZacros
pyZacros (Python Library for Automating Zacros Simulation) is a collection of tools that aims to provide a powerful, flexible, and easily extendable Python interface to Zacros, a Kinetic Monte Carlo software package for simulating molecular phenomena on catalytic surfaces. pyZacros is designed as an extension of the Python library PLAMS. This will, therefore, inherit from PLAMS the robust way of managing input file preparation, job execution, file management, and output file processing. Above that, it also offers the possibility of postprocessing the results and building very advanced data workflows.
The normal Zacros workflow has the following steps:
First, the subject of the problem (description of the system and set of the desired simulation parameters) has to be written to input text files (i.e.
energetics_input.dat,mechanism_input.dat,lattice_input.dat,simulation_input.dat).The
zacros.xprogram is executed and produces output text files (i.e.general_output.txt,procstat_output.txt,history_output.txt,specnum_output.txt,lattice_output.txt).Those output files may already contain the required information or at least contain enough information to get it after a postprocessing step.
This resultant information may be used to define parameters for further calculations.
pyZacros helps with the automation of all these steps described above directly from a python script and takes responsibility for tiresome and monotonous technical details allowing the user to focus on real science and your problem.
What can be done with pyZacros
As an extension of PLAMS, pyZacros is also designed under the same key principle: flexibility. If something (and by something, we mean adjusting an input parameter, executing a program with particular options, extracting a value from the output, etc.) can be done by hand, it can be done with pyZacros. The library’s internal structure was designed in a highly modular, especially object-oriented manner. In particular, there are classes to represent species, clusters, and elementary Reactions, among others, that are easy to set up and use.
The most important features of pyZacros:
Preparing, running, and examining results of Zacros jobs from within a single Python script
Convenient automatic file and folder management
Running jobs in parallel without a need to prepare a special parallel script
Integration with popular job schedulers (OGE, SLURM, TORQUE)
Prevention of multiple runs of the same job
Easy data transfer between separate runs
An efficient and simple way to restart the calculation in case of a crash or extend the simulation.
Almost full coverage of all input options and output data in Zacros.
Visualization and interactive building of the lattice of the system.
Default plot functions to visualize results like adlayer configurations, process statistics, and species numbers.
Reconstruction of the pyZacros objects from Zacros calculation, which were not managed by pyZacros.
Simple example
Here we show a simple pyZacros script that reproduces the Zacros tutorial Ziff-Gulari-Barshad (ZGB) Model in Zacros.
The ZGB model includes (see the script below):
Three gas species: CO, O2, and CO2. (Lines 5-7)
Three surface species: *, CO*, O*. (Lines 10-12)
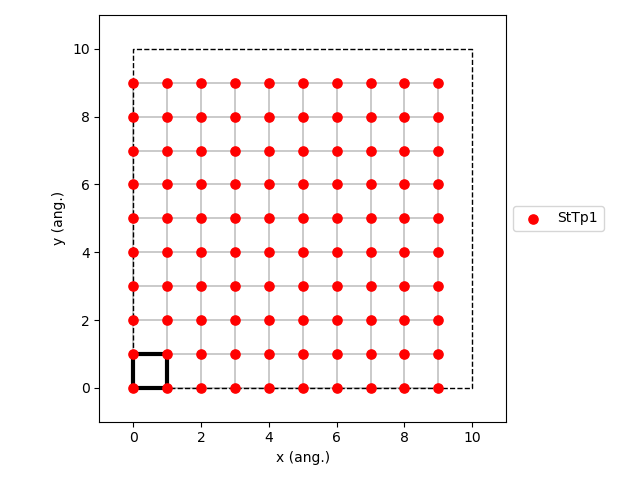
A rectangular lattice with a single site type. (Line 15)
Two clusters are included in the cluster-expansion Hamiltonian approach for the energetics. The CO* and O* individual adsorbates (without lateral interactions) with 1.3 eV and 2.3 eV binding energies, respectively. (Lines 19-20)
Three irreversible events: non-dissociative adsorption of CO, dissociative adsorption of O2, and fast reaction between an O adatom and a CO adsorbate. (Lines 23-43)
 1import scm
 2import scm.pyzacros as pz
 3
 4# Gas species:
 5CO_g = pz.Species("CO")
 6O2_g = pz.Species("O2")
 7CO2_g = pz.Species("CO2", gas_energy=-2.337)
 8
 9# Surface species:
10s0 = pz.Species("*")  # Empty adsorption site
11CO_s = pz.Species("CO*")
12O_s = pz.Species("O*")
13
14# Lattice setup:
15lattice = pz.Lattice(lattice_type=pz.Lattice.RECTANGULAR, lattice_constant=1.0, repeat_cell=[10, 10])
16lattice.plot()
17
18# Clusters:
19CO_p = pz.Cluster(species=[CO_s], energy=-1.3)
20O_p = pz.Cluster(species=[O_s], energy=-2.3)
21
22# Elementary Reactions
23CO_ads = pz.ElementaryReaction(
24    initial=[s0, CO_g], final=[CO_s], reversible=False, pre_expon=10.0, activation_energy=0.0
25)
26
27O2_ads = pz.ElementaryReaction(
28    initial=[s0, s0, O2_g],
29    final=[O_s, O_s],
30    neighboring=[(0, 1)],
31    reversible=False,
32    pre_expon=2.5,
33    activation_energy=0.0,
34)
35
36CO_oxi = pz.ElementaryReaction(
37    initial=[CO_s, O_s],
38    final=[s0, s0, CO2_g],
39    neighboring=[(0, 1)],
40    reversible=False,
41    pre_expon=1.0e20,
42    activation_energy=0.0,
43)
44
45scm.pyzacros.init()
46
47# Settings:
48sett = pz.Settings()
49sett.temperature = 500.0
50sett.pressure = 1.0
51sett.snapshots = ("time", 5.0e-1)
52sett.process_statistics = ("time", 1.0e-2)
53sett.species_numbers = ("time", 1.0e-2)
54sett.max_time = 25.0
55sett.random_seed = 953129
56
57sett.molar_fraction.CO = 0.45
58sett.molar_fraction.O2 = 0.55
59
60myJob = pz.ZacrosJob(settings=sett, lattice=lattice, mechanism=[CO_ads, O2_ads, CO_oxi], cluster_expansion=[CO_p, O_p])
61
62results = myJob.run()
63
64print("nCO2 = ", results.provided_quantities()["CO2"][-10:])
65results.plot_molecule_numbers(results.gas_species_names())
66results.plot_molecule_numbers(results.surface_species_names())
67
68scm.pyzacros.finish()
Don’t worry if something in the above code is incomprehensible or confusing. Everything you need to know to understand how pyZacros works and how to write your own scripts is explained in the next chapters of this documentation.
By executing the above script, you are going to see a visual representation of the lattice (see script’s line 16) that should be similar to the image below:
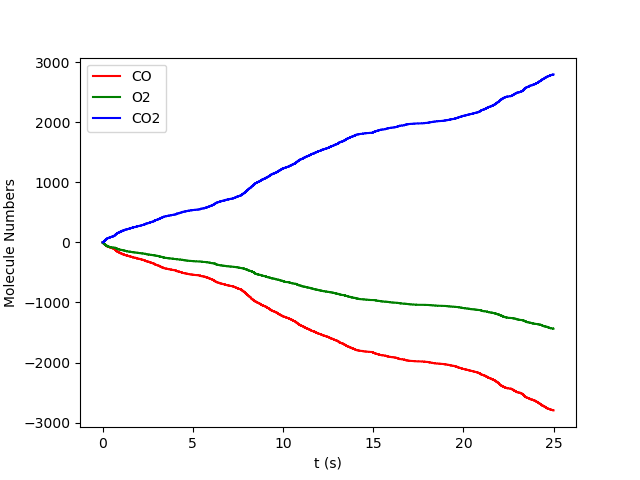
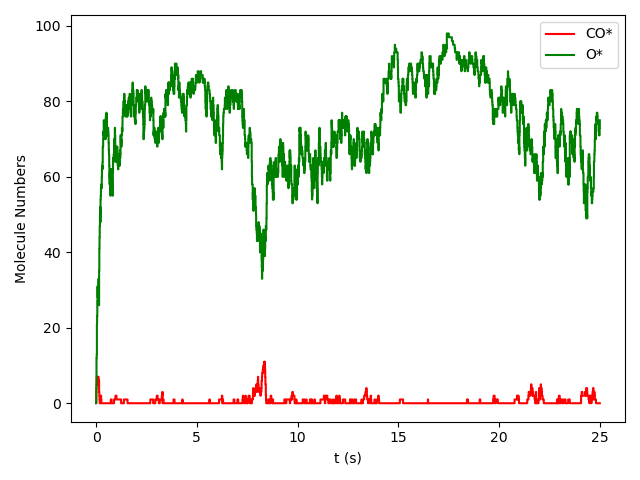
Then, you should see the plot of the number of molecules of each kind as a function of time during the simulation. We have split this information into two figures for clarity, one for gas-phase species and the other one for surface species, as follows (see script’s line 65-66):
During the execution, the following information is written to the standard output:
1PLAMS working folder: /home/user/plams_workdir
2[08.02|13:57:45] JOB plamsjob STARTED
3[08.02|13:57:45] JOB plamsjob RUNNING
4[08.02|13:57:45] JOB plamsjob FINISHED
5[08.02|13:57:45] JOB plamsjob SUCCESSFUL
6nCO2 =  [2790, 2790, 2790, 2792, 2792, 2793, 2793, 2795, 2797, 2797]
7[08.02|13:58:05] PLAMS run finished. Goodbye
It indicates that pyZacros created a uniquely named working folder (plams_workdir) and then ran the Zacros calculation in a separate
subfolder of the working folder (plamsjob). All the files created by each Zacros run are saved in the corresponding subfolder for future reference. However, notice that you can access the results directly from the python script. To illustrate this, see line 64 of the script that produces line 6 in the standard output, which prints the number of CO2 molecules produced in the last ten-time steps of the simulation.