Outputs
GloMPO produces various types of results files which can be configured via the GloMPOManager; all or none of them can be produced. A summary human-readable YAML file is the most basic record of the optimization. Image files of the optimizer trajectories can also be produced, as well as a compressed HDF5 file with all trajectory data and optimization metadata.
Several other outputs are also produced depending on the configuration of the optimization and the optimizers.
Real-Time Status Reports
GloMPO supports real-time status logging of an optimization. This can be directed to a file or the console (see Logging Messages).
Printstreams
Often optimizers will have been implemented by other developers and its BaseOptimizer class will simply be a wrapper around this code rather than a new implementation of the algorithm. In such circumstances, it is likely that these optimizers will incorporate print statements in their code. When GloMPO runs multiple optimizers in parallel, this can create an illegible console output as statements from different optimizers shuffle together. It also makes any GloMPO logging messages a user may have set up very difficult to follow and parse.
For this reason, the GloMPOManager.split_printstreams option is provided which automatically redirects optimizer print statements to separate printstream_xxxx.out text files. Errors are similarly redirected to printstream_xxxx.err files. xxxx is the four digit representation of each optimizer’s unique identification number. All these files are stored in the glompo_optimizer_printstreams directory created in GloMPOManager.working_dir.
Note
If your optimizers can be silenced in another way or do not contain print statements, it is better to use split_printstreams = False when initializing the manager. This avoids creating a large number of empty files.
Checkpoints
GloMPO supports creating ‘snapshots’ of the optimization in time. The checkpoint files are compressed into a single tarball from which the optimization can be resumed (see Checkpointing).
Python Result Object
GloMPOManager.start_manager() returns a Result object with the final minimization result and some basic optimization metadata. This allows a user to continue some operations after an optimization within the same script.
Manager Summary File
The most informative, human-readable, GloMPO output is the glompo_manager_log.yml file (produced by GloMPOManager.summary_files \(\geq\) 1). An example of which can be downloaded here and seen below. It includes all GloMPO settings, the final result, computational resources used, checkpoints created, as well as time and date information. These files can also be loaded by YAML at a later stage and their contents accessed like a dictionary.
Important
The manager summary file includes information about CPU usage, memory usage, and system load. This is useful traceback to ensure the function is being parallelized correctly. It is important to note that CPU usage and memory usage is provided at a process level, system load is provided at a system level. This means that the system load information will only be of use if GloMPO is the only application running over the entire system. In distributed computing systems where GloMPO is only given access to a portion of a node, this information will be useless as it will be conflated with the usage of other users.
The quality of this output is limited by the psutil version installed in the python environment and various system limitations detailed in that package’s documentation.
Assignment:
  Task: Schwefel
  Working Dir: /home/user53/glompo_runs/run_008
  Username: user53
  Hostname: node3263
  Time:
    optimization Periods:
      - Start: '2020-11-10 15:22:18.412977'
        End: '2020-11-10 15:22:56.375724'
    Total: '0:00:37.962747'
    Session: '0:00:37.962746'
Settings:
  x0 Generator:
    Generator: RandomGenerator
    n_params: 20
  Exit Conditions: |-
    MaxFuncCalls(fmax=121116)
  Stoppers: |-
    [
     [
      EvaluationsUnmoving(calls=500, tol=0.01) &
      ValueAnnealing(crit_stop_chance)
     ] |
     BestUnmoving(calls=8074, tol=0.2)
    ] |
    ParameterDistance(bounds, relative_distance=0.05, test_all=False)
  Optimizer Selector:
    Selector: CycleSelector
    Allow Spawn:
      IterSpawnStop:
        max_calls: 109004
    Available Optimizers:
      0:
        type: CMAOptimizer
        init_kwargs:
          workers: 1
          popsize: 12
        call_kwargs:
          sigma0: 500.0
  Max Jobs: 4
  Bounds:
    (-500, 500): [ 0, 1, 2, 3, 4, 5, 6, 7, 8, 9, 10, 11, 12, 13, 14, 15, 16, 17, 18,
                   19 ]
Counters:
  Function Evaluations: 121200
  Times Stoppers Evaluated: 10043
  Optimizers:
    Started: 18
    Stopped: 16
    Converged: 1
Run Information:
  Memory:
    Used:
      Max: --
      Ave: --
    Available: 92.78GB
  CPU:
    Cores:
      Total: 12
      IDs: [ 1, 34, 35, 5, 6, 10, 22, 23, 24, 26, 27, 30 ]
    Frequency: 0.0GHz
    Load:
      Average: [ 0 ]
      Std. Dev.: [ 0 ]
    CPU Usage(%):
      Average: 0
      Std. Dev.: 0
Solution:
  fx: -7371.403964491363
  origin:
    opt_id: 5
    type: CMAOptimizer
  exit cond.: |-
    MaxFuncCalls(fmax=121116) = True
  x: [ 420.96874696682596, 420.96874566727126, 420.96874680120084, 420.9687469639721,
       420.96874537846645, 420.9687477762165, 420.96874677352207, -500.0, -124.8293560430916,
       420.96874705250616, 420.9687462991201, 420.9687473178516, -302.52493527156935,
       420.9687464478644, 420.9687462591337, -302.52493479109353, -302.5249353300162,
       -302.52493489667165, 420.96874590791356, 420.96874612415513 ]
Plots
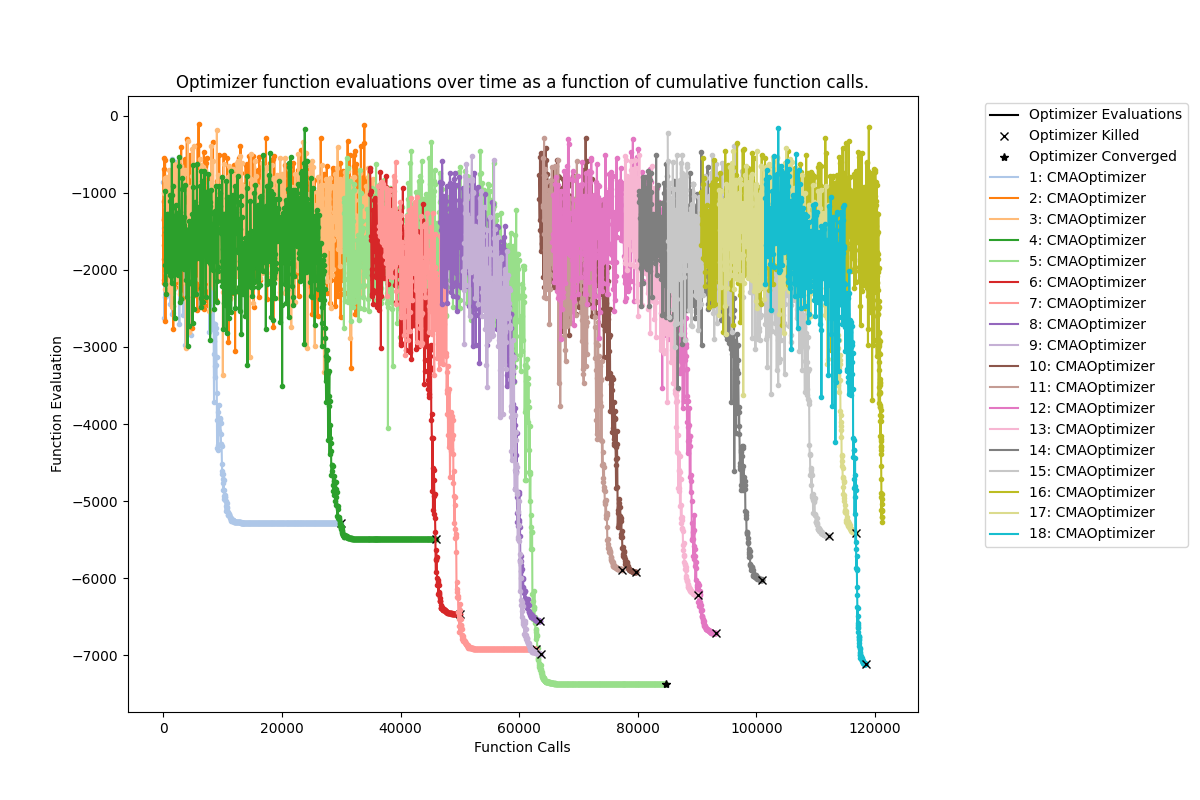
The best way to get an overall sense of how the optimization proceeded is by using the summary trajectory plots (produced by GloMPOManager.summary_files \(\geq\) 2). This requires matplotlib. Two plots are produced: trajectories.png and trajectories_best.png. The former shows the actual function evaluation results and the latter shows the best optimizer values. Below is an example of such a trajectory plot:
Optimizer Trajectory Log File
The most detailed output is stored in a compressed HDF5 file (produced by GloMPOManager.summary_files \(\geq\) 3). This includes all iteration and metadata information from the optimizers themselves. This file also contains all the manager metadata; in this way all information from an optimization can be accessed from one location. To work with these files within a Python environment, we recommend loading it with PyTables. To explore the file in a user-friendly GUI, we recommend using the vitables package.
It is within this HDF5 file that BaseFunction.detailed_call() information is saved if this is being used.
HDF5 log files have the following structure:
glompo_log.h5
|   This object contains manager and general optimization metadata in its attributes object.
|
+-- optimizer_1
|   |   This contains optimizer specific metadata in its attributes object.
|   |
|   +-- messages
|   |      An array of strings each representing a message sent by the optimizer to the manager.
|   |
|   +-- iter_history
|           A table of iteration results from the optimizer with the following columns:
|              call_id
|                 Unique iteration identifier across the entire optimization.
|                 The universal function evaluation number.
|              x
|                 Input space vectors.
|              fx
|                 Function results.
|              <others>
|                 Extras if the detailed_call method is used and returns extra information
|
+-- optimizer_2
|   +-- messages
|   +-- iter_history
+-- optimizer_3
|   +-- messages
|   +-- iter_history
.
.
.
Logger Classes
Within the GloMPO framework, the iteration history is tracked by a BaseLogger or a FileLogger. A BaseLogger holds all information in memory only, for the Stoppers and other GloMPO decision-making; used when an HDF5 log file has not been requested by the user.
In contrast, a FileLogger (which is a child of BaseLogger) maintains records in memory (for fast access) while simultaneously writing data to file during the optimization.
Neither of these classes should ever need to be accessed directly by users. They are set up and controlled directly by the GloMPOManager, but their documentation is provided here for reference.
- class BaseLogger(n_parms, expected_rows, build_traj_plot)[source]
Holds iteration results in memory for faster access.
- Parameters:
- n_parms
Number of parameters in the domain of the optimization problem.
- expected_rows
Estimated number of rows in each optimizer log file. Estimated by
GloMPOManagerbased on exit conditions and dimensionality of the optimization task.- build_traj_plot
Flag the logger to hold trajectories in memory to construct the summary image.
- Attributes:
- build_traj_plot
Trueif the user has asked for a trajectory plot at the end of the optimization. Used to decide whether to hold all iterations in memory or purge them during the optimization when they would no longer be needed for Stopper purposes.
- add_iter_history(opt_id, extra_headers=None)[source]
Extends iteration history with all the columns required, including possible detailed calls.
- property best_iters
Dictionary of the best iterations for each optimizer.
- See Also:
- classmethod checkpoint_load(path)[source]
Construct a new
BaseLoggerfrom the attributes saved in the checkpoint file located atpath.
- checkpoint_save(path='', block=None)[source]
Saves the state of the logger, suitable for resumption, during a checkpoint.
- Parameters:
- path
Directory in which to dump the generated files.
- block
Iterable of class attributes which should not be included in the log.
- clear_cache(opt_id=None)[source]
Removes all data associated with
opt_idfrom memory. The data is not cleared if a summary trajectory plot has been configured.
- get_best_iter(opt_id=None)[source]
Returns the overall best record in history if
opt_idis not provided. If it is, the best iteration of the corresponding optimizer is returned.
- get_history(opt_id, track)[source]
Returns data from the evaluation history of an optimizer.
- Parameters:
- opt_id
Unique optimizer identifier.
- track
Column name to return. Any column name in the logfile can be used. The following are always present:
'call_id': The overall evaluation number across all function calls.'x': Input vectors evaluated by the optimizer.'fx': The function response for each iteration.
- has_iter_history(opt_id)[source]
Returns
Trueif an iteration history table has been constructed for optimizeropt_id.
- property largest_eval
Returns the largest (finite) function evaluation processed thus far.
- property n_optimizers
Returns the number of optimizers in the log.
- plot_optimizer_trials(path=None, opt_id=None)[source]
Generates plots of parameter value versus optimizer function evaluation number for each parameter of input space.
- Parameters:
- path
Path to directory into which the image/s will be saved.
- opt_id
Optimizer for which the plot should be made. If
None, plots will be made for all optimizers.
- plot_trajectory(title, log_scale=False, best_fx=False)[source]
Generates a plot of function values versus the overall function evaluation number.
- Parameters:
- title
Path to file to which the plot should be saved.
- log_scale
If
Truethe function evaluations will be converted to base 10 log values.- best_fx
If
Truethe best function evaluation seen thus far by each optimizer will be plotted rather than the function evaluation at the matching evaluation number.
- class FileLogger(n_parms, expected_rows, build_traj_plot)[source]
Bases:
BaseLoggerExtends the BaseLogger to write progress of GloMPO optimizers to disk in HDF5 format through PyTables. Results of living optimizers are still held in memory for optimizer Stopping.
- add_iter_history(opt_id, extra_headers=None)[source]
Creates an iteration history table in the HDF5 file.
- add_optimizer(opt_id, opt_type, t_start)[source]
Creates an HDF5 file and memory log for a new optimizer.
- classmethod checkpoint_load(path)[source]
Construct a new
FileLoggerfrom the attributes saved in the checkpoint file located atpath
- clear_cache(opt_id=None)[source]
Clears information held in the cache for Stopping purposes. If
opt_idis provided then the corresponding optimizer is closed, else all optimizers are closed in this way.
- flush(opt_id=None)[source]
Writes iterations held in chunks to disk. If
opt_idis provided then the corresponding optimizer is closed, else all optimizers are closed in this way.
- open(path, mode, checksum)[source]
Opens or creates the HDF5 file.
- Parameters:
- path
File path in which to construct the logfile.
- mode
The open mode of the file.
'w'and'a'modes are supported.- checksum
Unique checksum value generated by
GloMPOManagerand stored in checkpoints and the logfile. When a checkpoint is loaded, GloMPO will confirm a match between the checksum value in the checkpoint and in the logfile before using it (see Checkpointing).