
Silicon Gate Oxide Characterization with XPS
Gate oxide nitrisation is employed in CMOS processing to increase material capacitance, allowing for smaller components to be manufactured. Nitrogen dosing needs to be balanced however, as nitrogen diffusion into the channel can cause trapping, leading to reduced transistor lifetimes.
To assure uniform wafer properties, angle-resolved X-ray photoelectron spectroscopy (ARXPS) is used to probe the nitrogen profile throughout the gate thickness. Deconvolution of these XPS spectra subsequently relies on accurate reference data on the chemical shifts, which are dependent on the local composition along the gate profile.
This tutorial will showcase the prediction of Si(2p) XPS spectra for various SiOxNy phases. The predicted phase shifts are used to analyze trends in experimental ARXPS spectra, illustrating the application of this workflow in semiconductor metrology.
Note
In order to obtain accurate predictions for XPS spectra, DFT calculations will be performed on extended systems. These calculations may take 8-12 hours on a 32 core system. You can choose to skip these calculations and only focus on the instructions provided for small systems when learning how to perform XPS calculations with BAND.
XPS Procedure
We will start by illustrating the basic procedure for XPS calculations for pure Silicon. The Δ-SCF method will be used in order to obtain the core electron binding energy relative to the valance band maximum (VBM).
This will require us to perform 2 calculations:
Determine the energy of the core-hole state
Determine the reference energy for the VBM-hole state
Note
Using the Fermi level as the reference state makes experimental comparison more difficult as its position is highly sensitive to the presence of sample impurities, leading to higher uncertainties. The VBM reference meanwhile remains static, and is considered the preferred approach when evaluating XPS binding energies for solids.[1]
Si(2p) Binding Energy in Si
The starting point for an XPS calculation is the minimum-energy structure of the solid compound. For Si, we can retrieve the coordinates from the built-in database.
 menu, type
Si and select the Si crystal structureAMSinput will automatically switch to the BAND engine when a solid structure is selected. We will now configure the settings for the VBM-hole calculation:
Si_VBM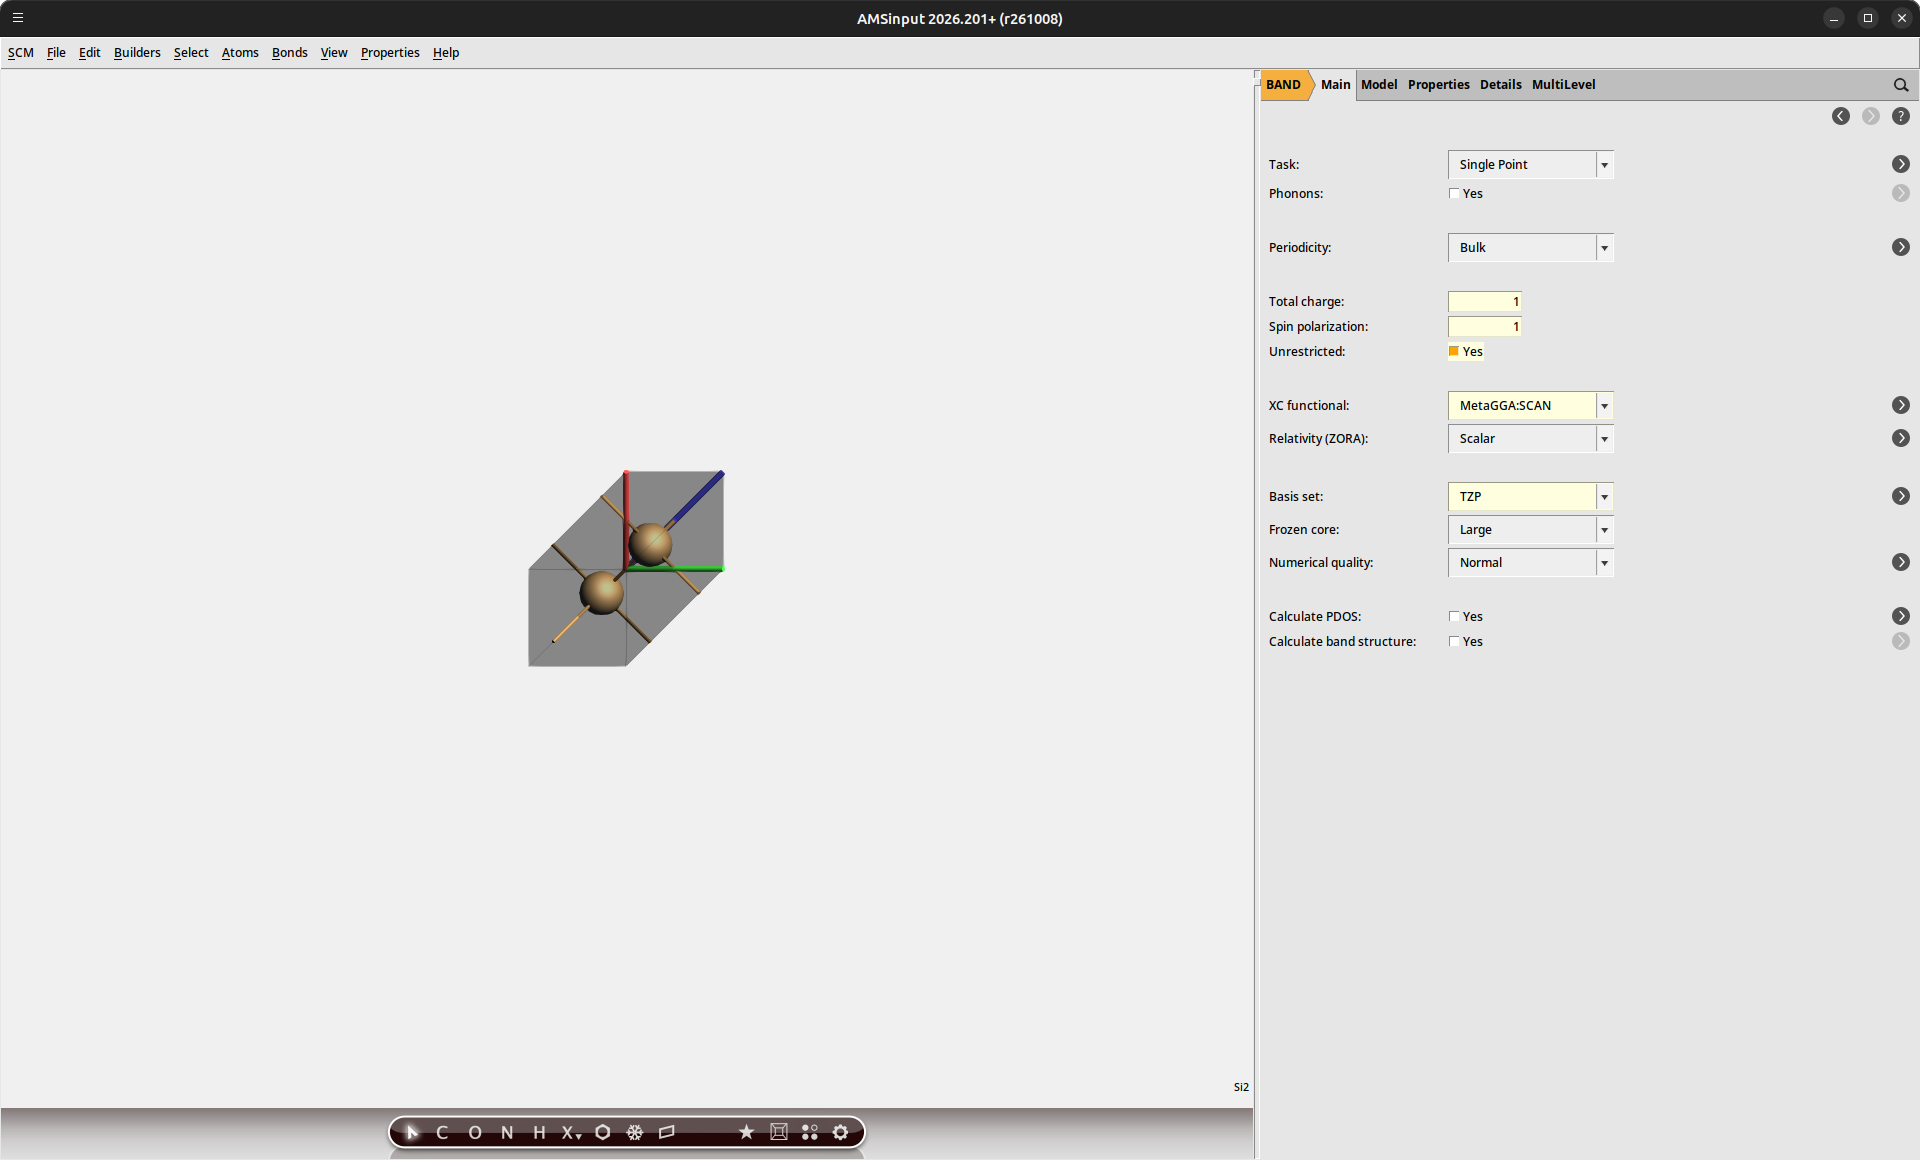
For the core-hole excitation, we additionally need to specify which core electron will be excited. The core states in our structure are ordered by ascending energy. Because our unit cell contains 2 Si atoms, we select the 5th orbital in order to determine the Si(2p) state.
Band |
Atom |
Core orbital |
|---|---|---|
1 |
Si(1) |
Si(1s) |
2 |
Si(2) |
Si(1s) |
3 |
Si(1) |
Si(2s) |
4 |
Si(2) |
Si(2s) |
5 |
Si(1) |
Si(2p) |
Si_CH_5b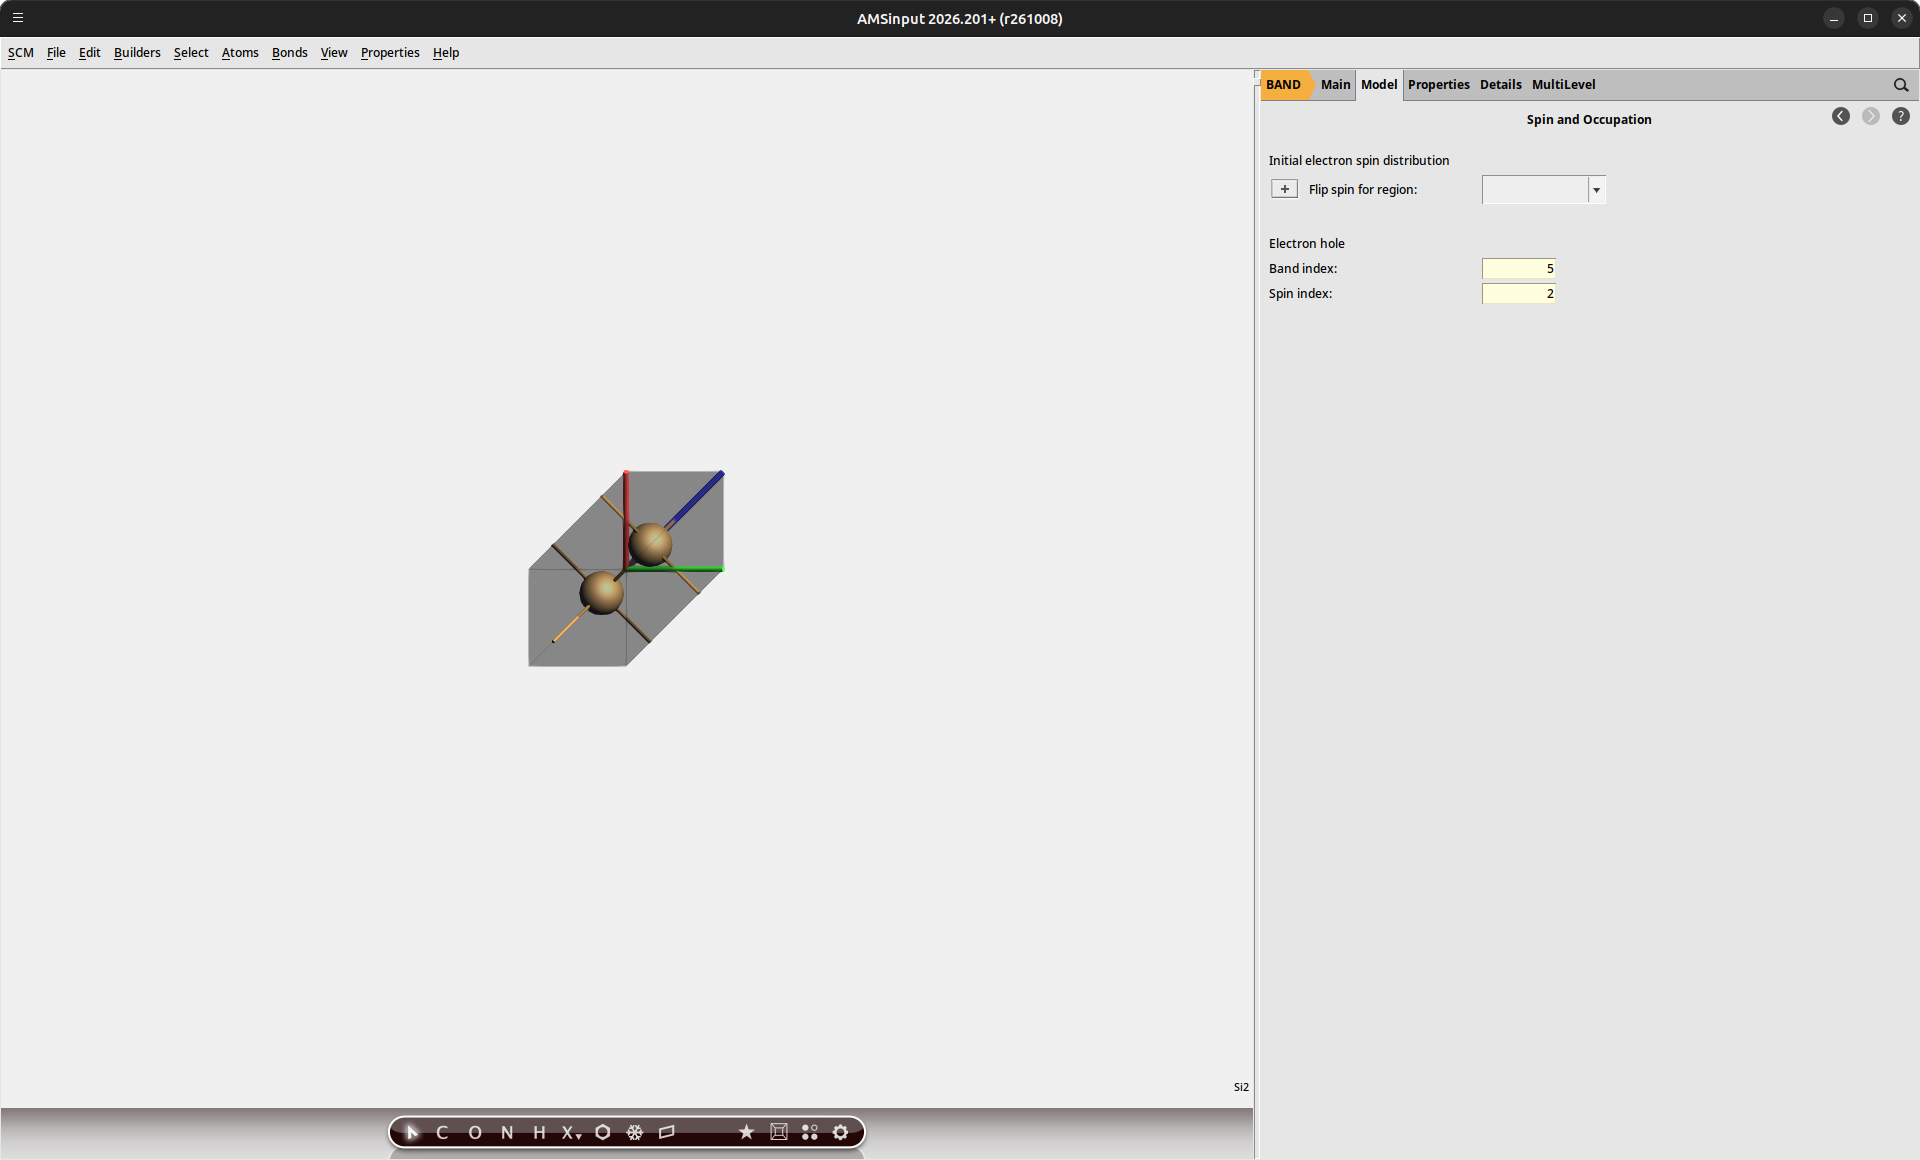
By performing an SCF calculation on the core-hole state, our calculations will explicitly include the relaxation of the electronic structure in the presence of the hole. Once both calculations have finished, we can extract the energy using AMSoutput.
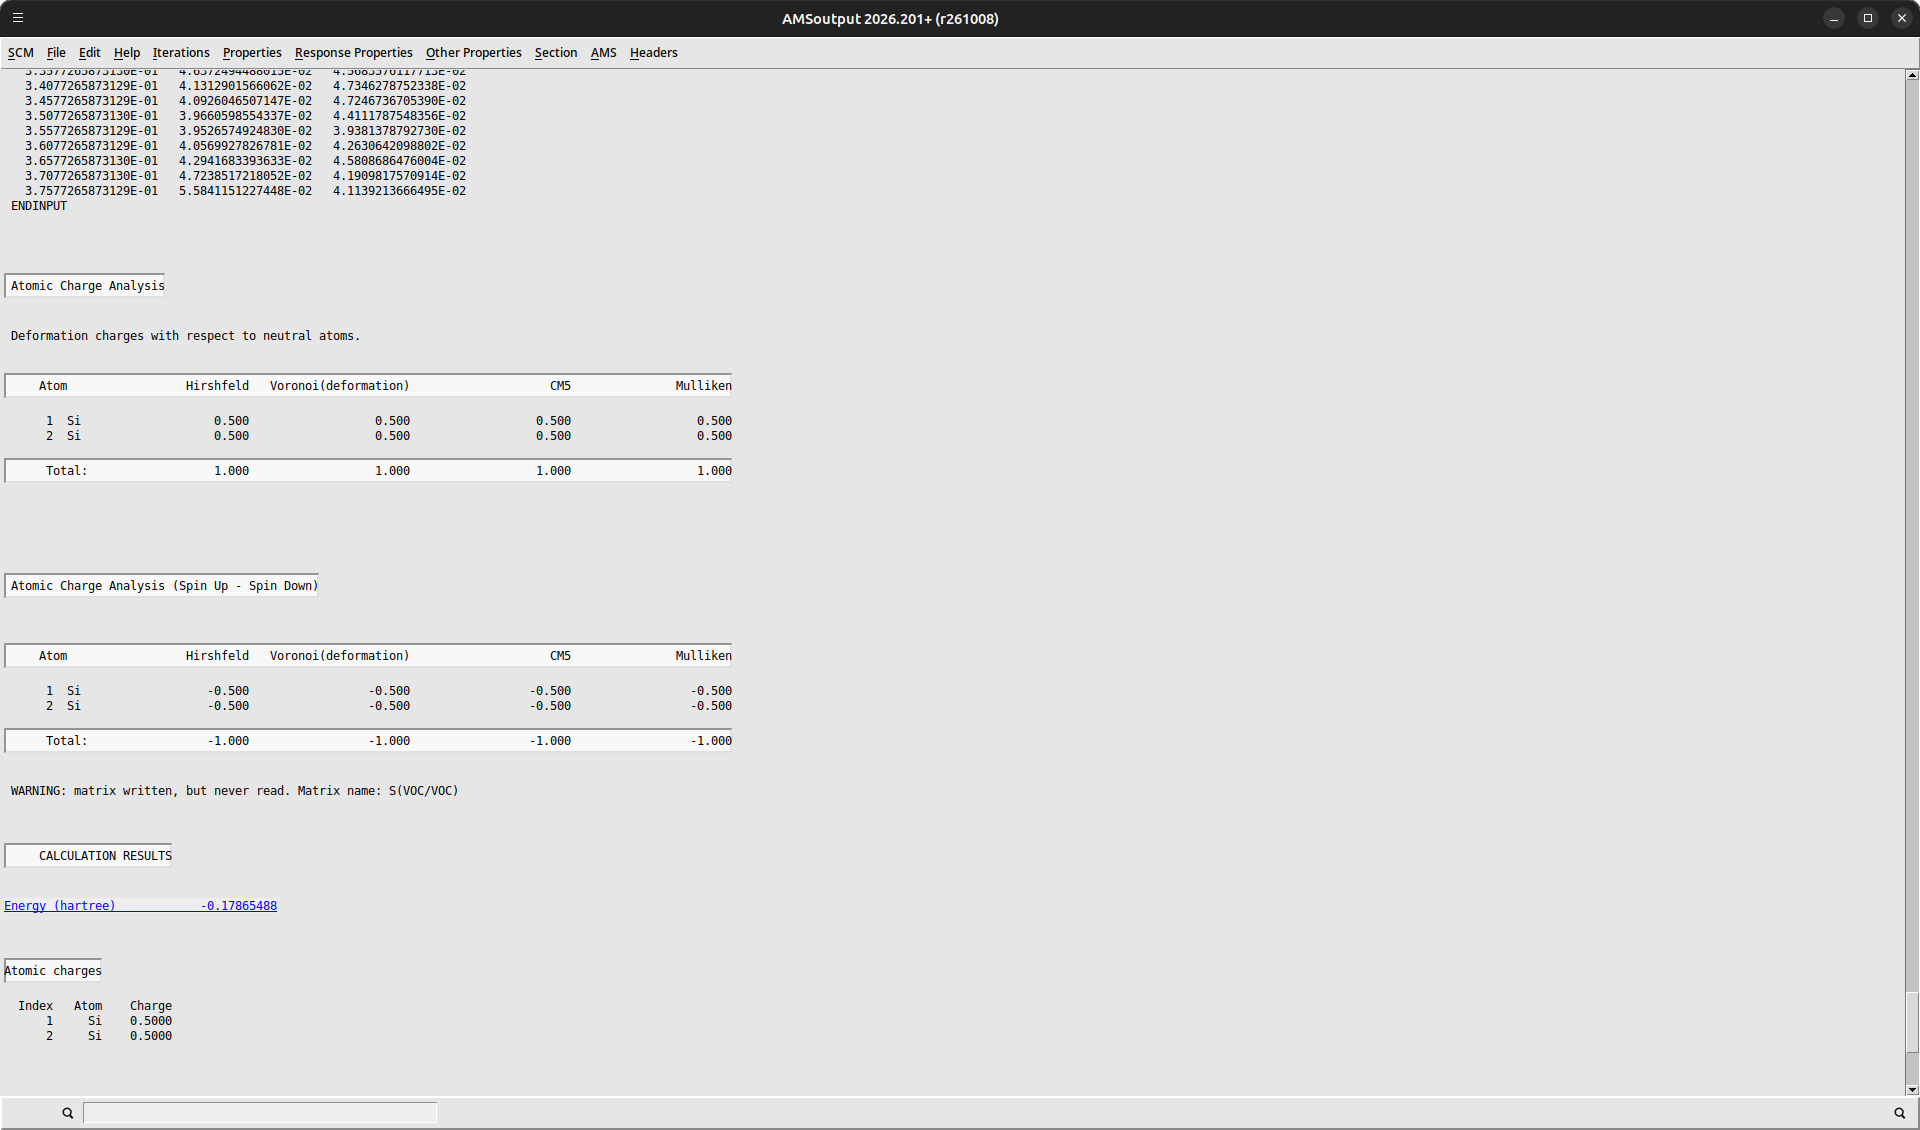
We can collect the results of our calculations here:
Variable |
Energy (Ha) |
Energy (eV) |
|---|---|---|
\(E_h^{N-1}(\textrm{VBM})\) |
-0.1787 |
-4.86 |
\(E_h^{N-1}(5)\) |
3.4046 |
92.64 |
\(E_b\) |
3.5832 |
97.51 |
This initial result produces quite a poor estimate for the XPS binding energy resulting from the use of a small periodic unit cell. This effectively increases the hole density, resulting in hole-hole interactions across the system. In order to obtain accurate predictions for the binding energies, it is required to obtain our data in the limit of isolated holes.
Supercell Convergence
The central approach is to repeat our calculation for a larger supercell, from which we can then extrapolate the limiting values.
Si_VBMSi_333_VBM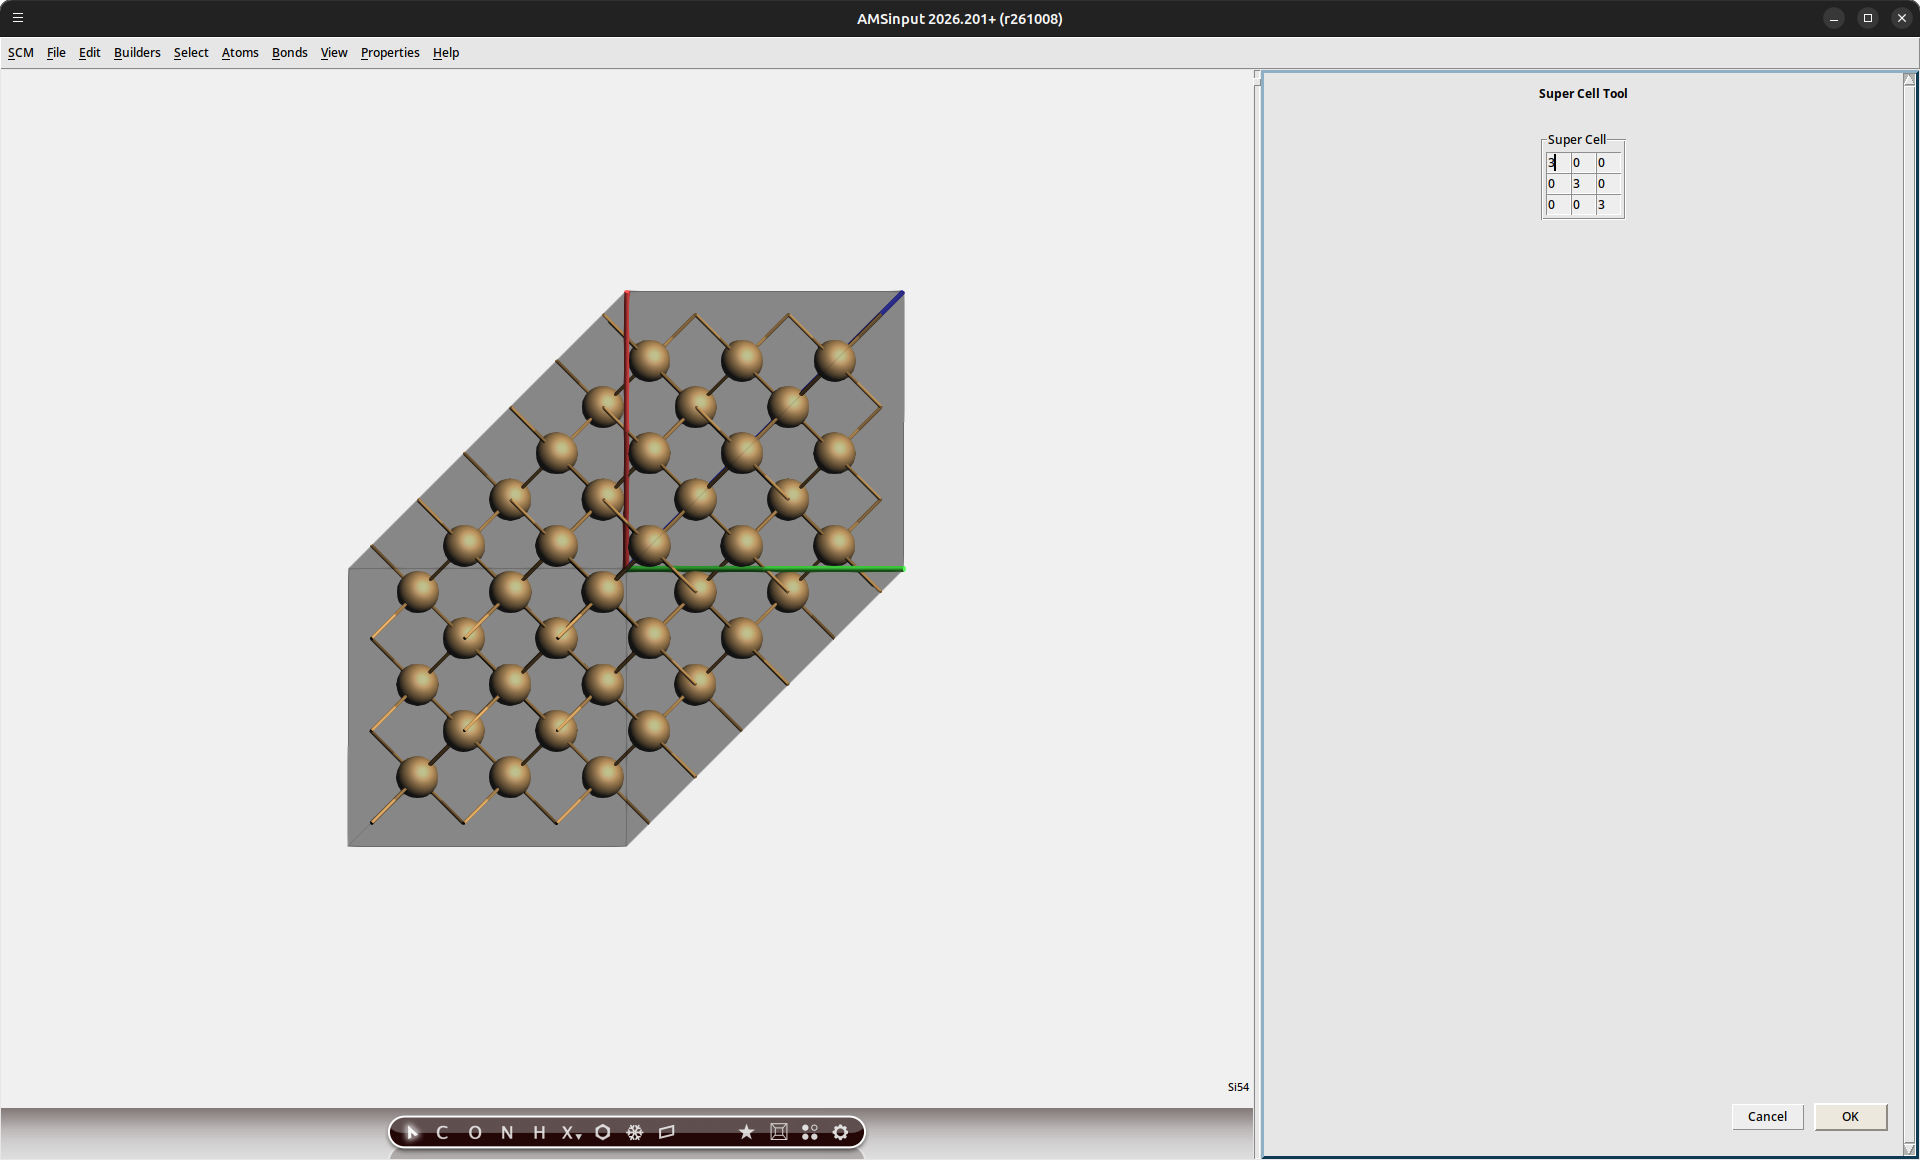
Note
The recommended approach would be to perform a linear interpolation between energies obtained for 1x1x1, 2x2x2 and 3x3x3 cells. A 1x1x1 calculation can sometimes fall outside of the linear regime, particularly when small unit cells are used. Visual inspection of the energies is recommended to confirm that the linear extrapolation approach is valid. Datapoints for unit cells larger than 3x3x3 are seldom needed.
Because the number of atoms in our cell has increased, the band index for the core-hole state must be adapted as well.
Si_333_CH_109bThe binding energies obtained from supercell calculations of 2x2x2 and 3x3x3 cells are shown in the figure below. The extrapolation towards the limit of the isolated hole is highlighted visually.
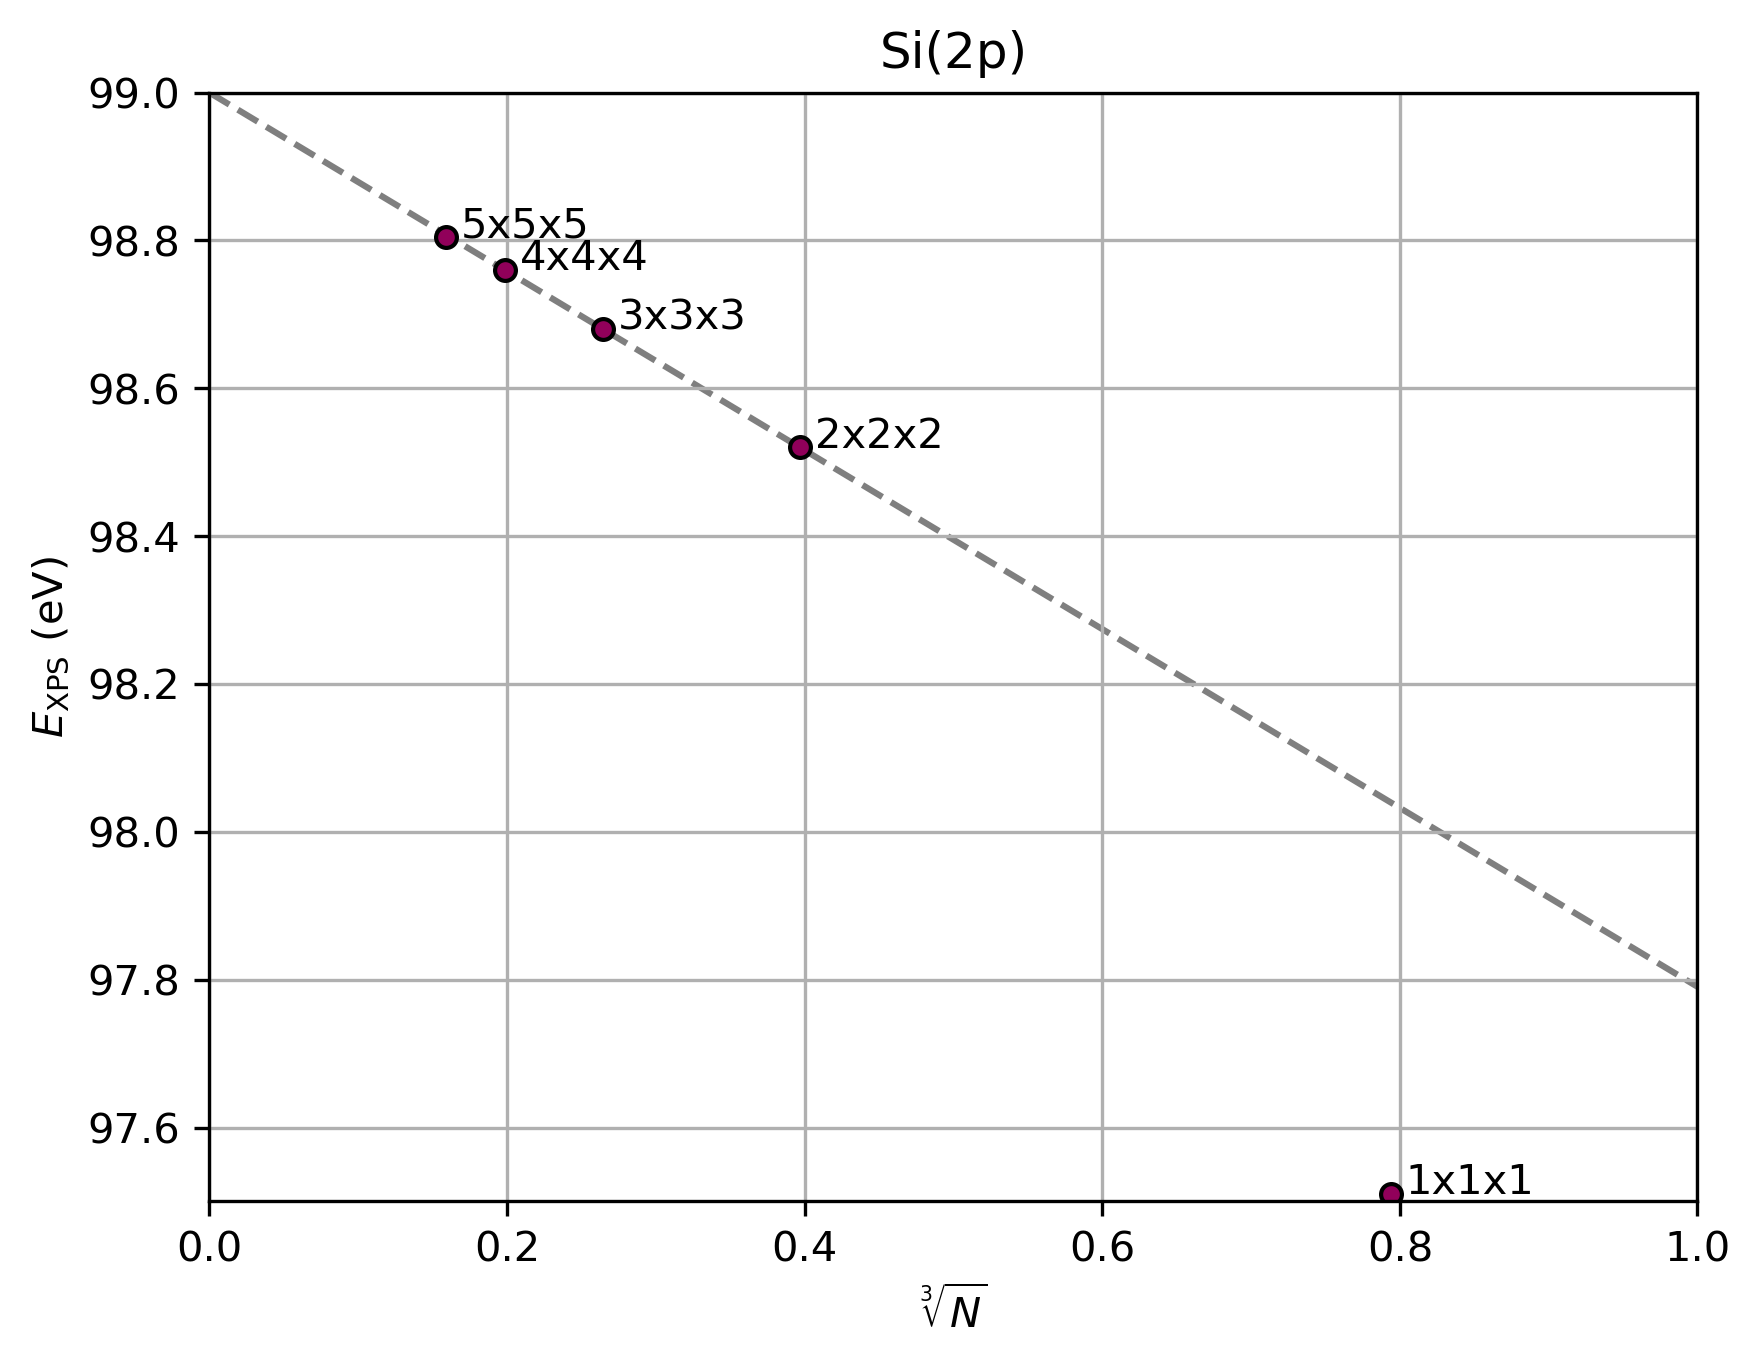
Fig. 73 Si(2p) binding energies predicted using BAND for different unit cell sizes. The grey line indicates a linear fit through the 2x2x2 and 3x3x3 data
We can see that the results for the 1x1x1 cell fall outside the linear extrapolation regime due to the high effective hole density in the small cell. We therefore make use of the 2x2x2 and 3x3x3 cells to perform the extrapolation to the limit of the isolated hole.
Where \(N\) denotes the number of atoms in each supercell.
Variable |
Energy (eV) |
|---|---|
\(E_b(\textrm{1x1x1})\) |
97.51 |
\(E_b(\textrm{2x2x2})\) |
98.52 |
\(E_b(\textrm{3x3x3})\) |
98.68 |
\(E_b(N\downarrow{0})\) |
99.00 |
The resulting binding energy now fully matches the experimental value[2] of 99.03 eV (to within the accuracy of DFT). A brief comparison between the values predicted from the individual cell calculations highlights the importance of evaluating the isolated hole limit.
Si(2p) Binding Energy in SiOxNy
We can extend our study towards other SiOxNy phases in order to provide reference data for interpreting experimental spectra. We will consider both SiO2 and Si2N3 phases as saturation points for the binary compositions. The intermediate Si3O5N1 and Si3O4N2 compositions will be evaluated to show the shift in binding energy with increased nitrogen content.
The SiO2 structure is available in the AMSinput database under the name
AlphaQuartz.The Si2N3 structure can also be loaded from the database directly.
The Si3O5N1 structure can be made by substituting one of the oxygen atoms in the SiO2 structure with nitrogen. (Using Atoms → Change atom type in AMSinput.)
The Si3O4N2 structure can be made by substituting one of the oxygen atoms in the Si3O5N1 structure with nitrogen.
For each of these phases, we repeat the XPS procedure outlined before:
Perform the VBM-hole calculation for the 2x2x2 supercell
Perform the VBM-hole calculation for the 3x3x3 supercell
Perform the core-hole calculation for the 2x2x2 supercell
Perform the core-hole calculation for the 3x3x3 supercell
The results of these calculations have been summarized in the figure below.
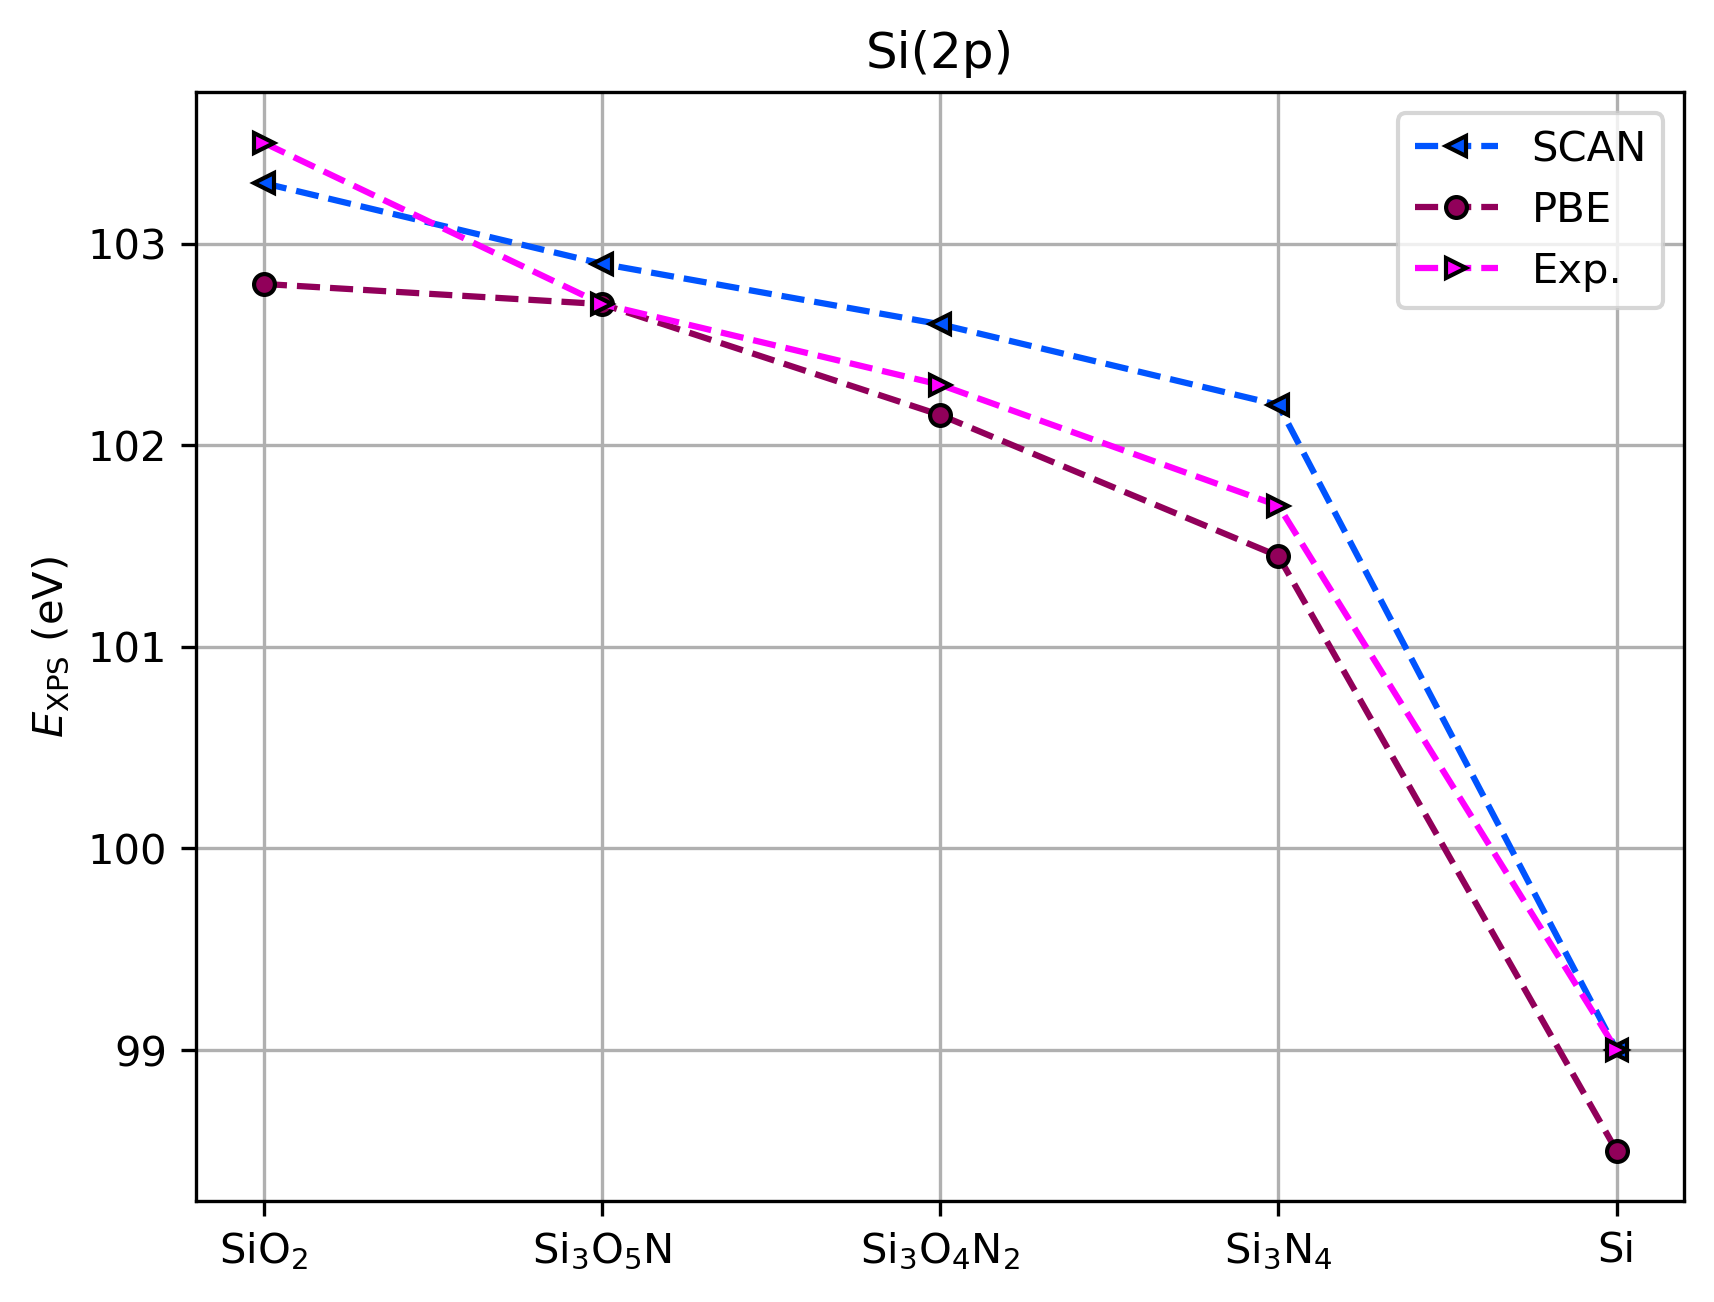
Fig. 74 Comparison between experimental XPS binding energies[2] and Δ-SCF predictions using BAND
Phase |
\(E_b^{calc}\) (eV) |
\(E_b^{exp}\) (eV) |
|---|---|---|
SiO2 |
103.3 |
103.5 |
Si3O5N1 |
102.9 |
102.7 |
Si3O4N2 |
102.6 |
102.3 |
Si2N3 |
102.2 |
101.7 |
Si |
99.0 |
99.0 |
Good agreement with experimental values is obtained. With increasing nitrogen content, we see a shift in the XPS signal towards lower binding energy, following the decreased electronegativity relative to oxygen. The values obtained at different nitrogen content levels can be correlated to experimental ARXPS measurements to determine the nitrogen profile inside a plasma-treated gate oxide.[2] Because the chemical shifts are dependent on the phase, characterization of the dominant crystal structures inside the gate can also be performed.
The high accuracy of the XPS binding energy calculations provides a reasonable level of confidence in predictive modeling strategies. 2 key aspects should however be considered:
Extrapolation towards the isolated hole limit must be performed in order to obtain reliable estimates for XPS binding energies in solids
Peak distances between different core signals will exhibit higher errors, as the DFT prediction error is not one-sided. E.g. the SiO2 binding energy is slightly overestimated, while Si2N3 is slightly underestimated
See also
Spin-orbit coupling, responsible for peak splitting in XPS spectra, was not considered in the current tutorial as the doublet splitting for Si(2p) is less than the typical accuracy range of DFT, and can therefore not be disambiguated.
For other systems, such as HfO2, this effect is much greater and should be considered in the calculations. This is easily achieved by enabling the Relativity → Spin-Orbit option in AMSinput.