
Designing precursors for area-selective alumina deposition
Area-selective atomic layer deposition (AS-ALD) requires a precursor to react on the intended growth surface while minimizing deposition on the non-growth surface. Adsorption matters even before a chemical reaction occurs: a precursor that binds to an inhibitor-covered surface may initiate unwanted growth. Precursor design must therefore balance Lewis acidity, steric accessibility, and surface-binding strength.
Maue and co-workers investigated these competing effects for aluminum precursors on hydroxylated silica and on silica modified with the small-molecule inhibitor trimethoxypropylsilane (TMPS) [1]. Fluoride ion affinity (FIA) is a gas-phase descriptor of precursor Lewis acidity. The adsorption energy quantifies binding to a particular surface site, while periodic energy decomposition analysis (pEDA) resolves the attractive and repulsive contributions to the interaction between the precursor and the surface. Together, these quantities help assess potential precursor designs, but none independently predicts area selectivity.
In this tutorial, you will investigate diisopropylaluminum chloride, Al(iPr)2Cl, a candidate motivated by the design principles proposed in that study. Two bulky isopropyl groups and one chloride ligand combine steric shielding with a potentially Lewis-acidic Al center. The exercise considers a neutral monomer at one silanol site; it does not assume that the monomer is the dominant species in the precursor vapor.
We use GFN1-xTB for rapid, approximate quantum-mechanical calculations of FIA and the UMA machine-learning potential to explore adsorption geometries and energies without an electronic self-consistent-field cycle. BAND provides an explicit electronic-structure analysis of the adsorbed contact.
This tutorial will teach you how to:
calculate an electronic FIA;
calculate a relaxed adsorption energy;
divide an adsorbed system into fragments and run pEDA;
interpret the three results together.
Model availability and starting structures
Use AMS2026 with access to the UMA-S-1.2-OMat model and its FAIRChem backend.
Only one starting structure is needed: silica_reference.xyz, containing
the paper’s 117-atom hydroxylated silica slab. You will build the precursor
from SMILES, then add it above a silanol site in AMSinput. The XYZ file
contains both atomic coordinates and lattice vectors, which AMSinput reads
on import. You will define the regions and constraints manually below; the
separately built molecular reference must use the same lattice vectors.
A benchmark to motivate the screening calculation
Figure 3 of the paper [1] compares AlMe3, AlMe2Cl, AlMeCl2 and AlCl3 on bare silica and TMPS-modified silica. The comparison below reproduces the BAND analysis and adds relaxed UMA-OMat+D4 adsorption energies and Al–O distances, together with GFN1-xTB and published FIAs. Each method’s relative adsorption energies use its own AlMe3 reference on each surface; values from different methods must not share a single reference energy. FIA is a gas-phase property, so the same molecular series is shown for both surfaces.
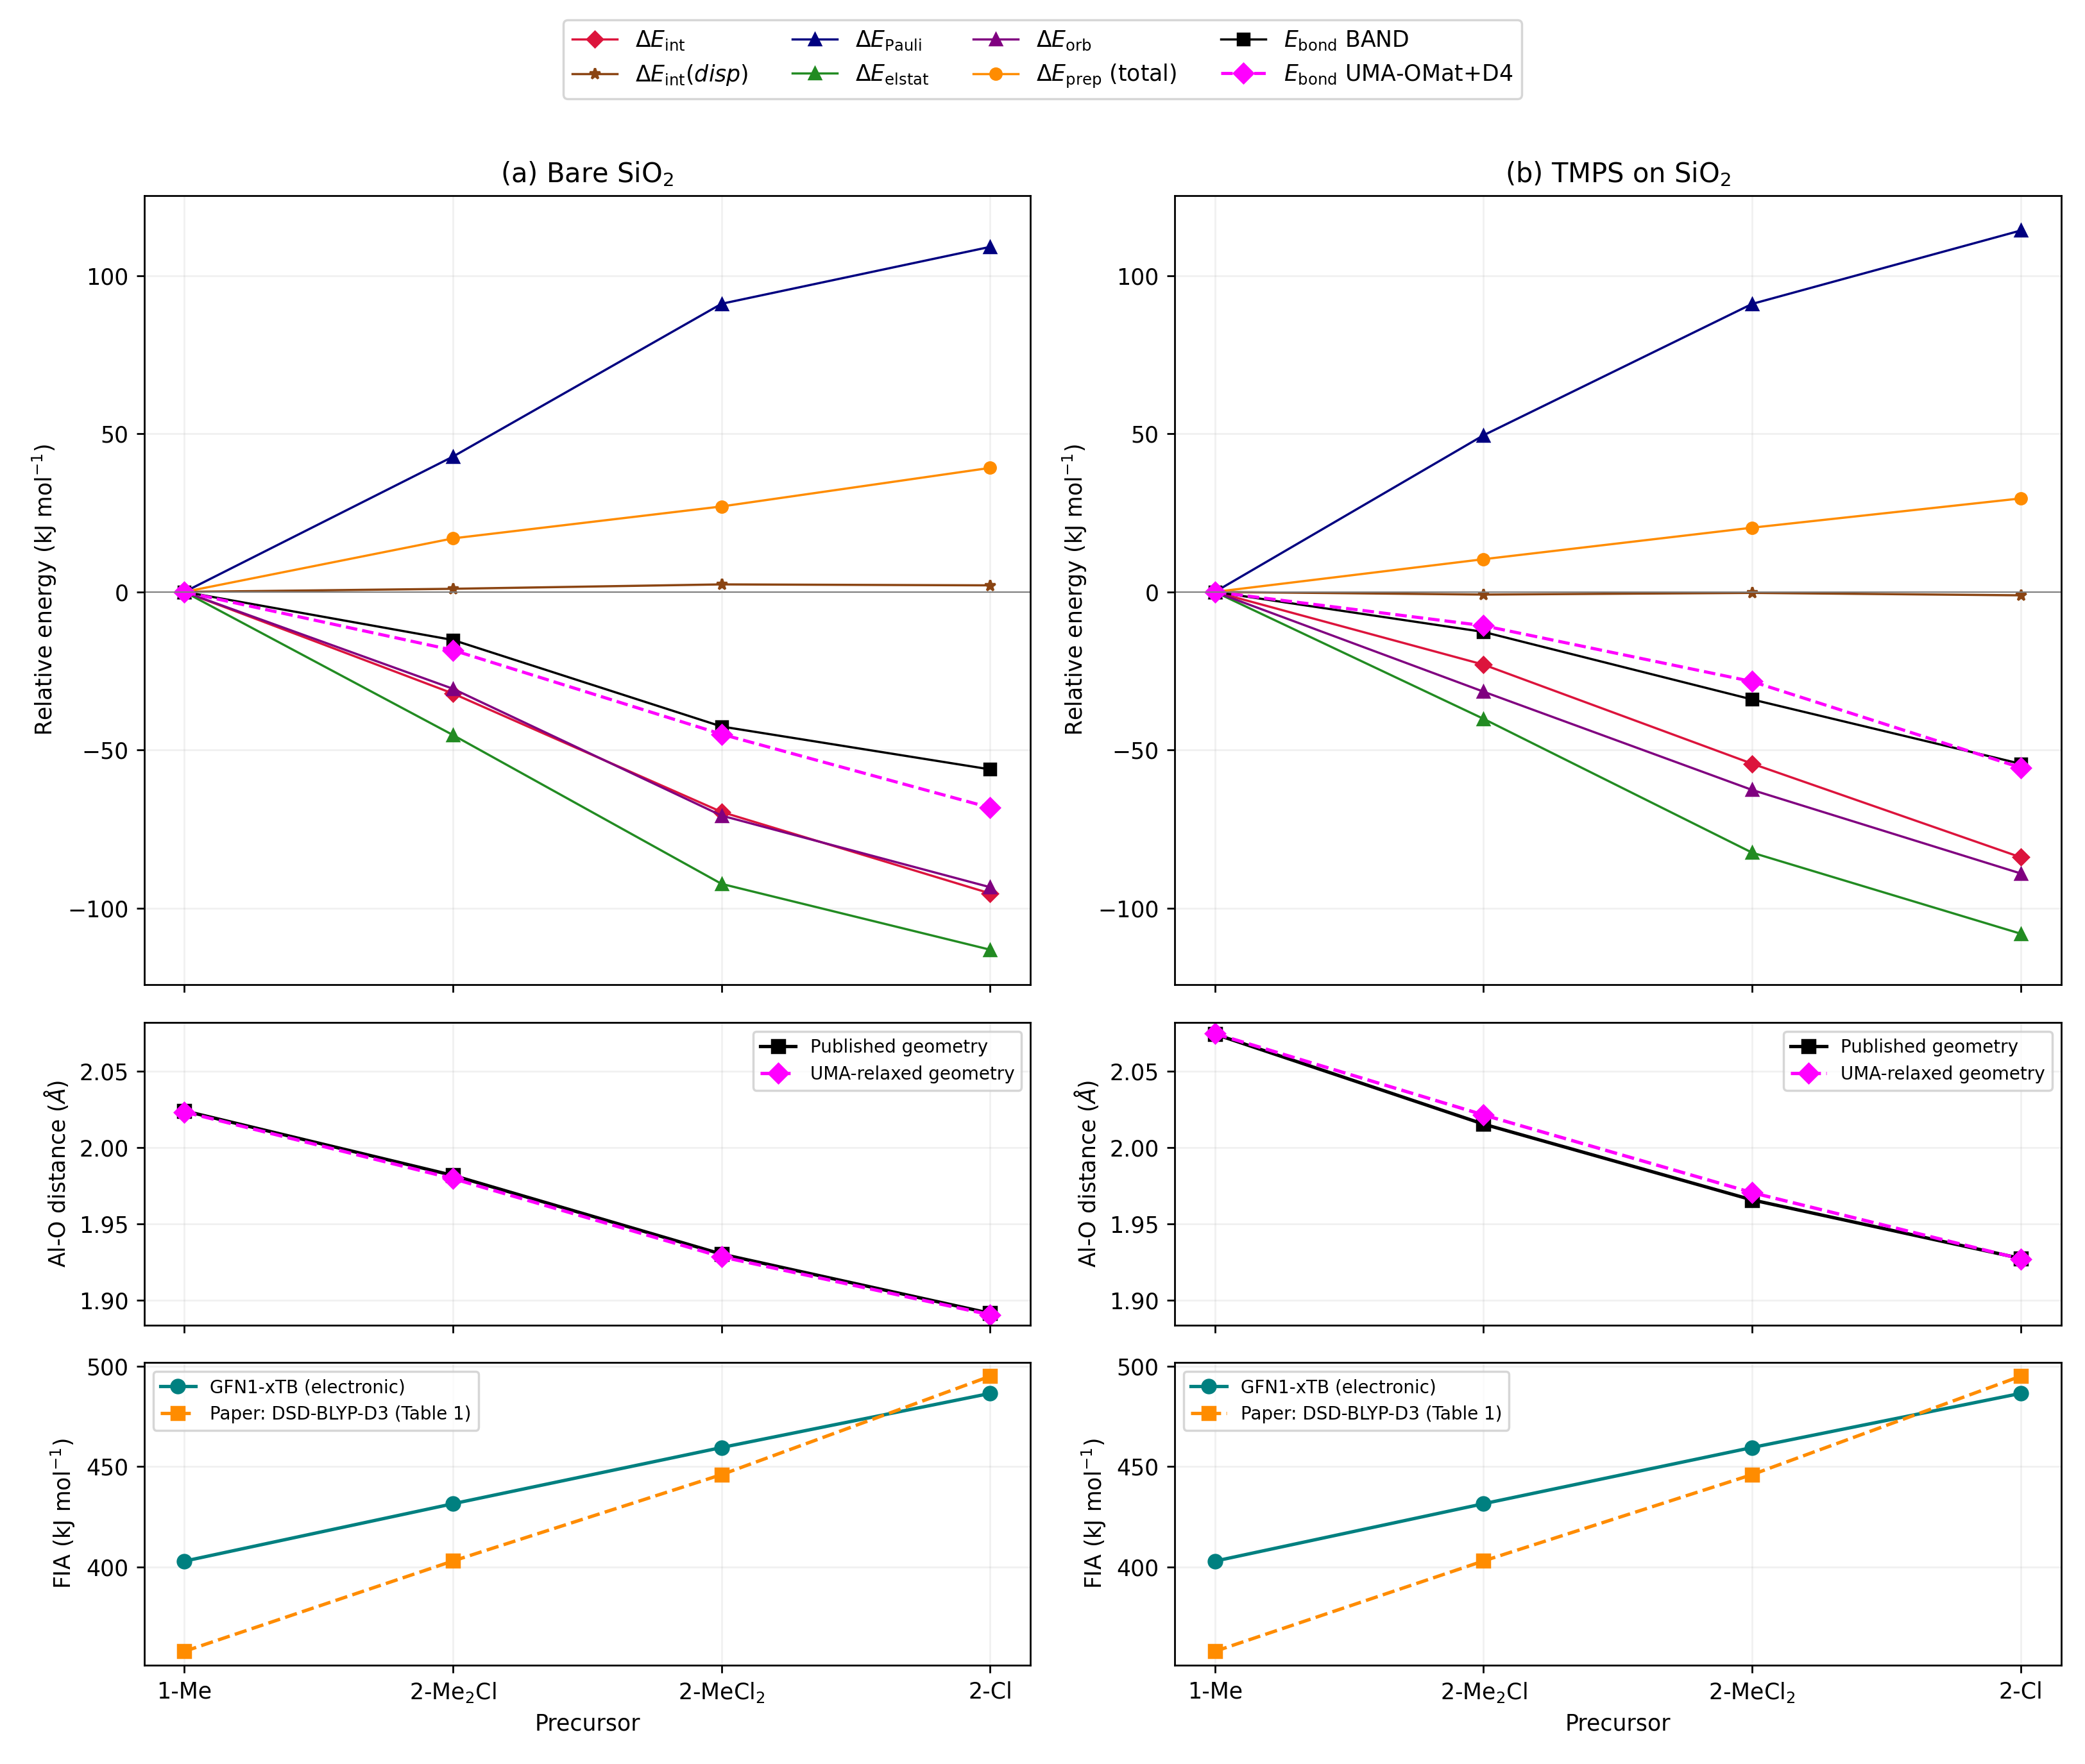
Fig. 29 Figure 3 comparison. BAND: PBE-D3(BJ)/TZ2P at the published geometries. UMA: UMA-S-1.2-OMat with a PBE-D4 dispersion correction; the complex and both isolated references are relaxed separately. The bottom panels compare electronic GFN1-xTB FIAs with Table 1 of Ref. [1]. All upper-panel energy terms are relative to AlMe3 within each method and surface; distances and FIAs are absolute.
The paper finds that increasing chlorination strengthens adsorption and shortens the Al–O distance on both surfaces. For bare silica, going from AlMe3 to AlCl3 strengthens bonding by about 55 kJ/mol and shortens Al–O by 0.133 Å. Electrostatic attraction and orbital interaction become more favorable, outweighing the increase in Pauli repulsion and fragment preparation energy. Dispersion changes little across this particular series. Thus, the acidity increase explains the chlorination trend, but the same conclusion need not apply to increasing ligand size: steric access, Pauli repulsion and dispersion also change [1].
The reproduced BAND bonding energies differ from the rounded Supporting Information values by 0.91 kJ/mol on average, supporting the consistency of the reproduction. UMA preserves the ordering and gives Al–O distances within 0.0061 Å of the published geometries, but its adsorption energies are more negative than the reproduced BAND values by 15.3 kJ/mol on average. This comparison also involves different geometries, so the difference cannot be attributed to the energy model alone. GFN1-xTB preserves the FIA ordering, with a mean absolute deviation of 23.9 kJ/mol from the published values, although it compresses the FIA range.
These four compounds support using fast methods to screen and rank related candidates, not treating them as generally validated quantitative substitutes for DFT. OMat is a materials-focused model; a new organoaluminum compound, its isolated molecular reference and a different adsorption motif require independent checks. The published FIA is defined using a reaction enthalpy, whereas the xTB calculation below gives an electronic energy difference without thermal corrections. Those corrections should be evaluated rather than assumed to be transferable between molecules. Promising candidates can be checked with a higher-level molecular DFT calculation, for example PBE0-D3(BJ) in ADF, using consistent geometries and energy definitions.
Method and geometry |
Quantity |
AlMe3 |
AlMe2Cl |
AlMeCl2 |
AlCl3 |
|---|---|---|---|---|---|
Published |
Enthalpy FIA |
358 |
403 |
446 |
495 |
GFN1-xTB, relaxed |
Electronic FIA |
402.9 |
431.5 |
459.5 |
486.4 |
ADF PBE0-D3(BJ), paper geometry |
Electronic FIA |
353.9 |
400.7 |
448.1 |
497.0 |
ADF PBE0-D3(BJ), relaxed |
Electronic FIA |
354.1 |
400.9 |
448.3 |
497.0 |
ADF PBE0-D3(BJ), relaxed |
Enthalpy FIA |
355.3 |
400.3 |
446.4 |
494.2 |
ADF r²SCAN-D4, paper geometry |
Electronic FIA |
365.7 |
411.6 |
457.7 |
505.3 |
ADF r²SCAN-D4, relaxed |
Electronic FIA |
366.0 |
411.8 |
457.9 |
505.3 |
ADF r²SCAN-D4, relaxed |
Enthalpy FIA |
367.2 |
411.3 |
456.0 |
502.5 |
The ADF calculations use the all-electron Corr/ATZ3P basis, scalar ZORA and
VeryGood numerical quality. Paper geometry denotes the archived PBEh-3c
coordinates. Enthalpy FIAs include harmonic thermal corrections at 298.15 K
and 1 atm.
PBE0-D3(BJ) gives the closest agreement with the published FIAs for this series: its mean absolute deviation is 2.6 kJ/mol on the paper geometries and 1.7 kJ/mol after relaxation and thermal corrections. The corresponding relaxed r²SCAN-D4 enthalpies systematically overestimate the reference, with a mean absolute deviation of 8.8 kJ/mol. Both methods preserve the chlorination trend, and relaxation changes their electronic FIAs by less than 0.3 kJ/mol. These ADF calculations use a different basis and geometry protocol from the paper, so the comparison tests practical agreement rather than exactly reproducing its high-level calculation.
Calculate one FIA with GFN1-xTB
For a neutral precursor A, fluoride binding follows \(\mathrm{A+F^-\rightarrow AF^-}\). We define the positive electronic fluoride ion affinity as
Optimize A and AF− separately, and calculate the isolated fluoride ion once. All three species are closed-shell singlets.
Build and optimize the precursor
CC(C)[Al](Cl)C(C)C using Edit → Paste.C6H14AlCl (22 atoms). →
 . Set Model to GFN1-xTB and Task to Geometry Optimization.
0. Use Periodicity → None.candidate_xtb using File → Save As, then File → Run.Note
To estimate vibrational and thermal corrections, enable Frequencies in the main panel and inspect the resulting thermochemical quantities in the output. Use the same temperature and energy convention for every species.
GFN1-xTB includes its native dispersion treatment.
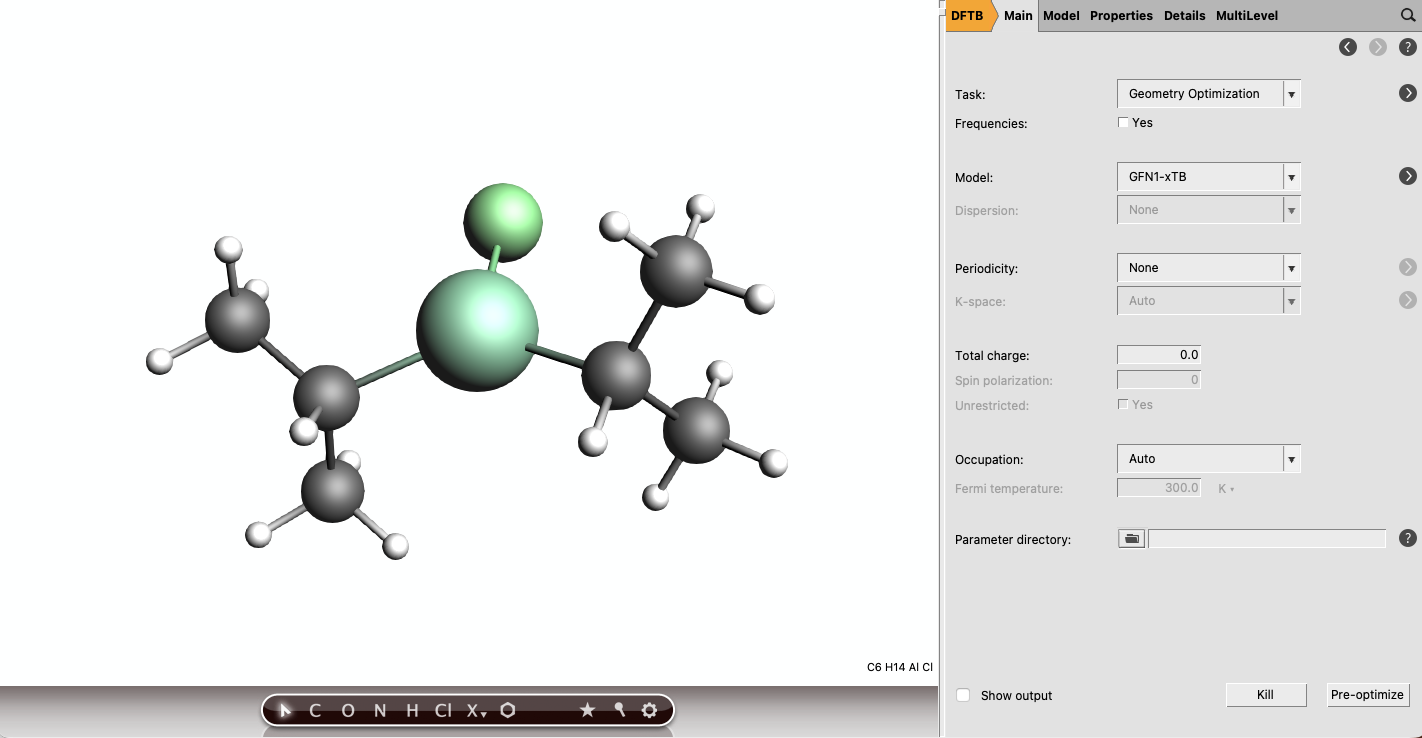
Fig. 30 Neutral precursor calculation with GFN1-xTB.
Note
For an ADF calculation, select Geometry Optimization, Hybrid → PBE0, D3(BJ) dispersion, Corr/ATZ3P basis, Frozen core → None, Scalar ZORA relativity and Very Good numerical quality. Apply these settings to all three species, using Single Point for F−.
Calculate the adduct and fluoride reference
Start each species in a new input window so that atoms from an earlier calculation are not retained.
F[Al-](Cl)(C(C)C)C(C)C. Inspect a four-coordinate Al center bonded to F, Cl and the two isopropyl groups. The formula is C6H14AlClF (23 atoms).-1. Use the same convergence settings as for the neutral precursor.candidate_fluoride_xtb.[F-]. Select DFTB, GFN1-xTB, Single Point, Periodicity → None, and Charge -1.fluoride_xtb.Read and combine the energies
E(candidate_xtb) + E(fluoride_xtb) - E(candidate_fluoride_xtb). Multiply the Hartree difference by 2625.50 to express the FIA in kJ/mol.For this example, we obtain an electronic FIA of 448 kJ/mol.
A larger positive FIA indicates stronger fluoride binding and, within a consistent method, generally greater Lewis acidity. At the same GFN1-xTB level, the candidate lies between AlMe2Cl (431.5 kJ/mol) and AlMeCl2 (459.5 kJ/mol) in the benchmark table. These values do not establish that steric effects will be favorable at a surface. The calculation contains no vibrational, thermal or solvent corrections. Different conformers can also change the result: one optimization per species is an initial screen, not a conformational search.
Calculate one adsorption energy with UMA
The surface calculation asks whether the monomer binds favorably to one silanol oxygen on bare silica (the unprotected non-growth surface in the reference study). The relaxed adsorption energy is
Negative values mean favorable binding relative to the isolated precursor and surface.
The complex will contain 139 atoms: the 117-atom silica slab and a 22-atom precursor. The slab, complex and isolated molecular reference use the same three-dimensional cell, including vacuum normal to the slab. Keeping the cell fixed makes the periodic settings consistent for all three UMA energies.
Import the silica and define the support
silica_reference.xyz. . Set Model to UMA-S-1.2-OMat and confirm Periodicity → Bulk.
surface.bottom. In Model → Geometry Constraints and PES Scan, click + next to bottom (fixed position).silica_start using File → Save As.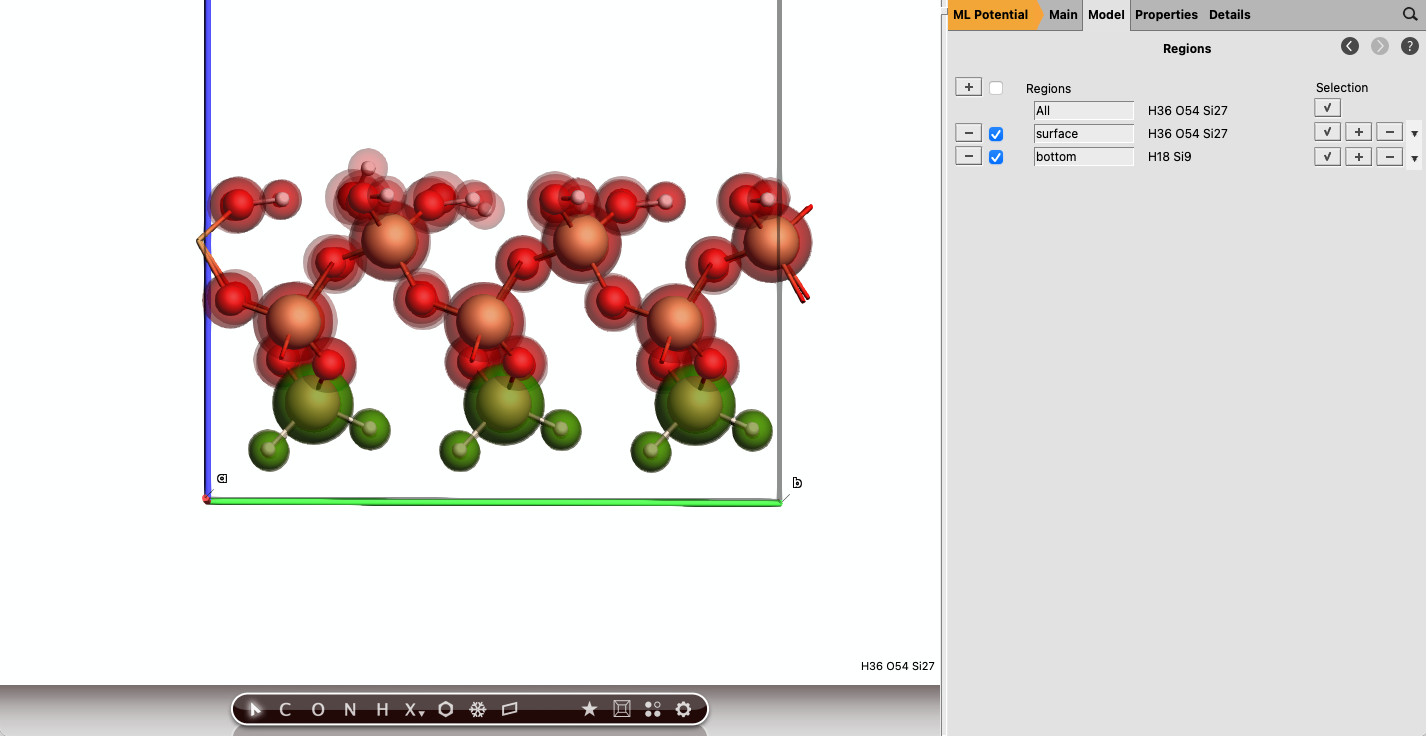
Fig. 31 Regions of the silica surface.
In the source model, the bottom region consists of 9 Si and
18 H atoms, all below z = 2.3 Å. The next atoms are above z = 2.99 Å,
so these layers can be separated in the side view. Use Model → Coordinates
to check the selected atoms if needed. The bottom region intentionally
overlaps surface. It fixes the same substrate atoms as in the source model.
Build and relax the molecular reference
Reuse the neutral precursor that you built from the SMILES
CC(C)[Al](Cl)C(C)C for the FIA. This supplies a molecular starting geometry,
but its adsorption reference energy must be recalculated with UMA+D4.
candidate_xtb job in AMSinput and click Update Molecule next to Task to load its optimized coordinates.candidate_uma. Switch from to and select UMA-S-1.2-OMat and Geometry Optimization.silica_reference.xyz, enter the three lattice vectors read from the imported slab in Model → Lattice.1000.candidate_uma. After convergence, reopen it in AMSinput and click Update Molecule.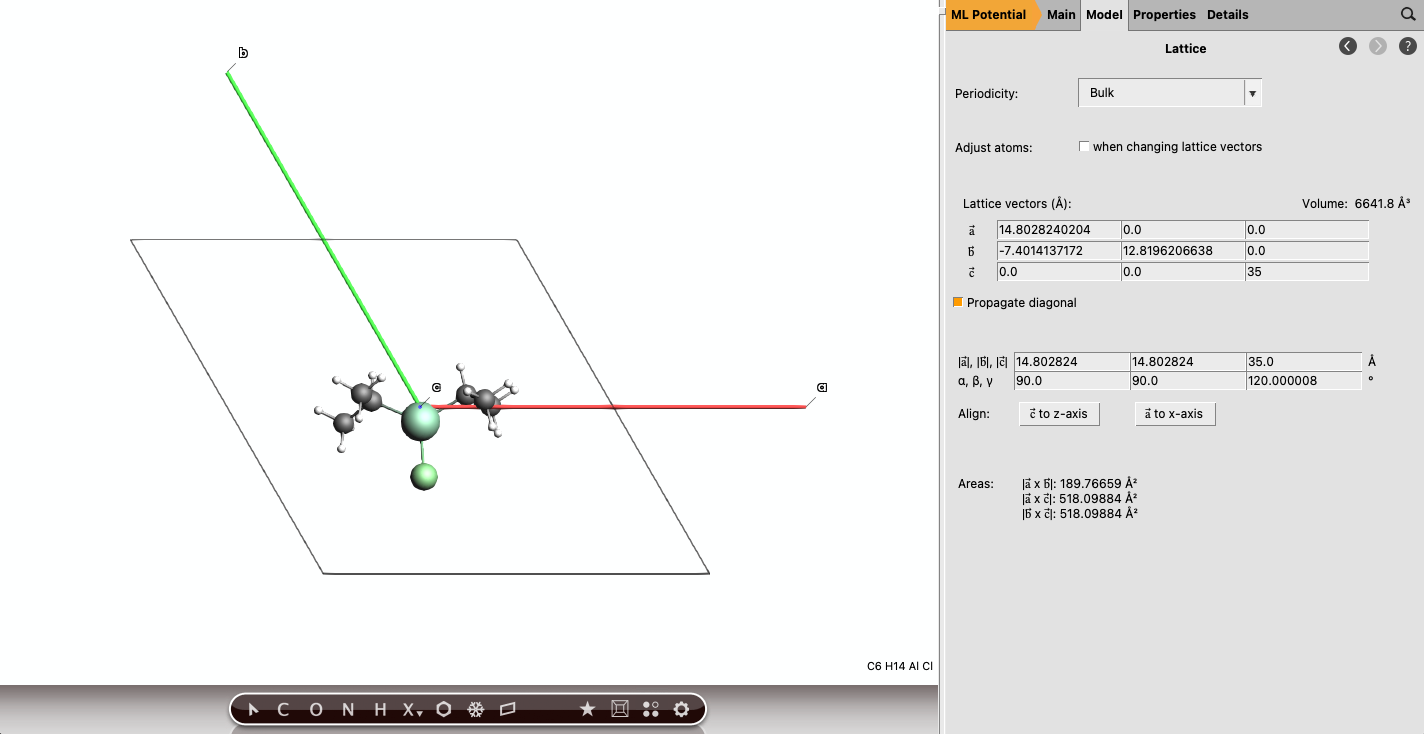
Fig. 32 Lattice panel of the precursor for optimization with UMA.
Place the candidate above the silica
candidate_uma input, select all 22 atoms and choose Edit → Copy.silica_start in another AMSinput window. Click in the molecular view and choose Edit → Paste to add the molecule to the slab. The newly pasted atoms are selected.precursor. Check that surface still contains only the original 117 atoms.2.5 Å. With the Al and O selected, you can use the horizontal slider to adjust the distance. Reselect the whole precursor region before making further rigid translations or rotations.candidate_surface_uma.Start each drag on the selected molecule: dragging in empty space changes the
view instead. For finer adjustments, use Edit → Tune Geometry…. Store
the 22-atom selection with the selection button next to Atoms to move;
then use Translate atoms, direction with x, y or z directions and a step
of 0.1 Å. This translates the precursor without moving the slab or changing
its internal geometry.
Choose a top-side silanol oxygen bonded to one Si and one H, rather than a bridging Si–O–Si oxygen. The starting 2.5 Å distance is a placement suggestion, not an optimized bond length. Different sites and molecular orientations can relax to different minima; the subsequent calculation samples one starting pose.
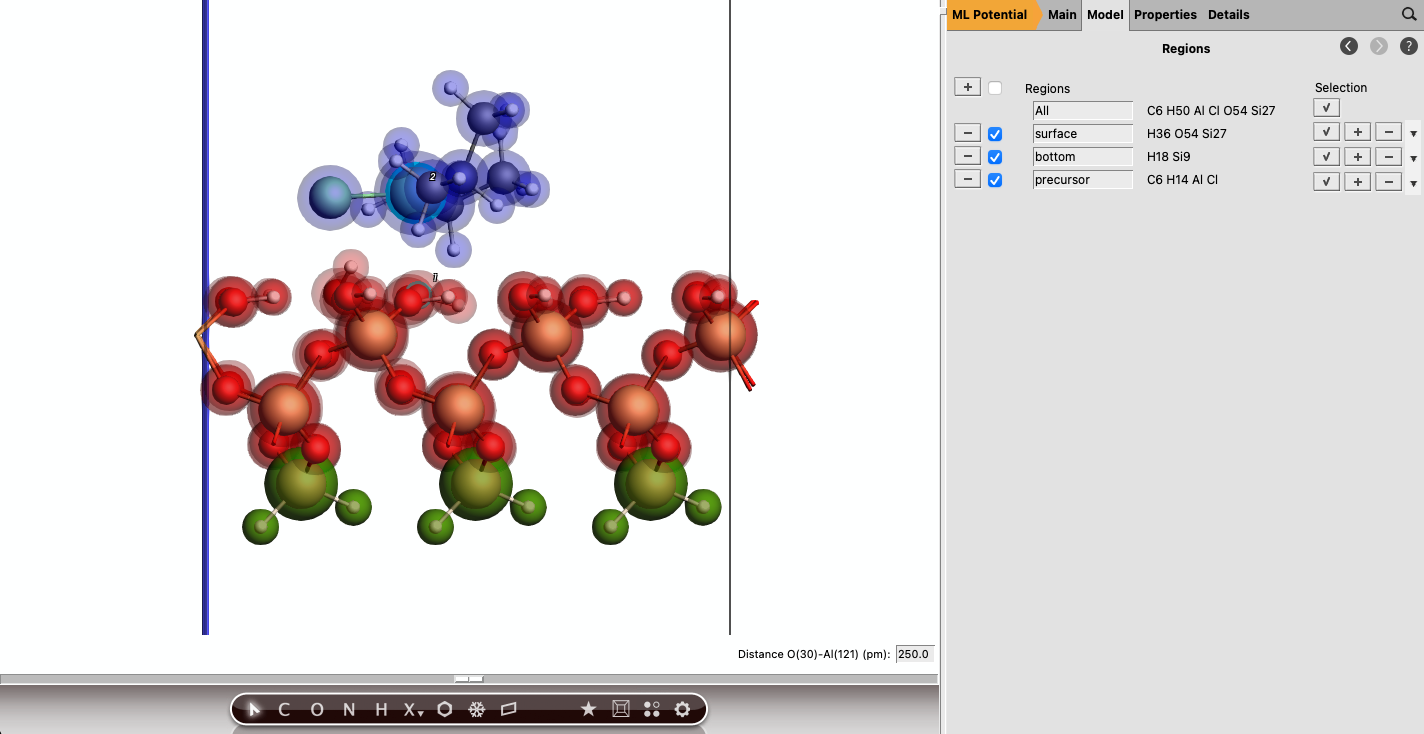
Fig. 33 Place the intact precursor above a silanol before relaxing the adsorption geometry.
Relax the complex and bare surface
candidate_surface_uma, set Model → UMA-S-1.2-OMat and Task → Geometry Optimization. Enable D4 dispersion with Functional → PBE in Details → Engine Add-ons.bottom has fixed positions. The precursor and upper surface atoms must be mobile.1000.candidate_surface_uma. Inspect the trajectory in SCM → Movie to confirm that the precursor remains near the intended silanol site. If it desorbs or binds elsewhere, inspect the final geometry and, if appropriate, try a different initial placement.silica_start, use File → Save As to create silica_uma, and apply the same UMA model, D4 correction, and optimization settings as for the complex. Retain the bottom fixed-position constraint and run the bare-surface job.All three energies now come from separately relaxed UMA+D4 structures, with the same fixed cell and, for the two slab calculations, the same fixed substrate atoms.
Tip
When settings are spread across several panels, inspect the run script to confirm that all options have been applied. AMSinput generates the run script when you save the job; you can view it under Details → Run Script.
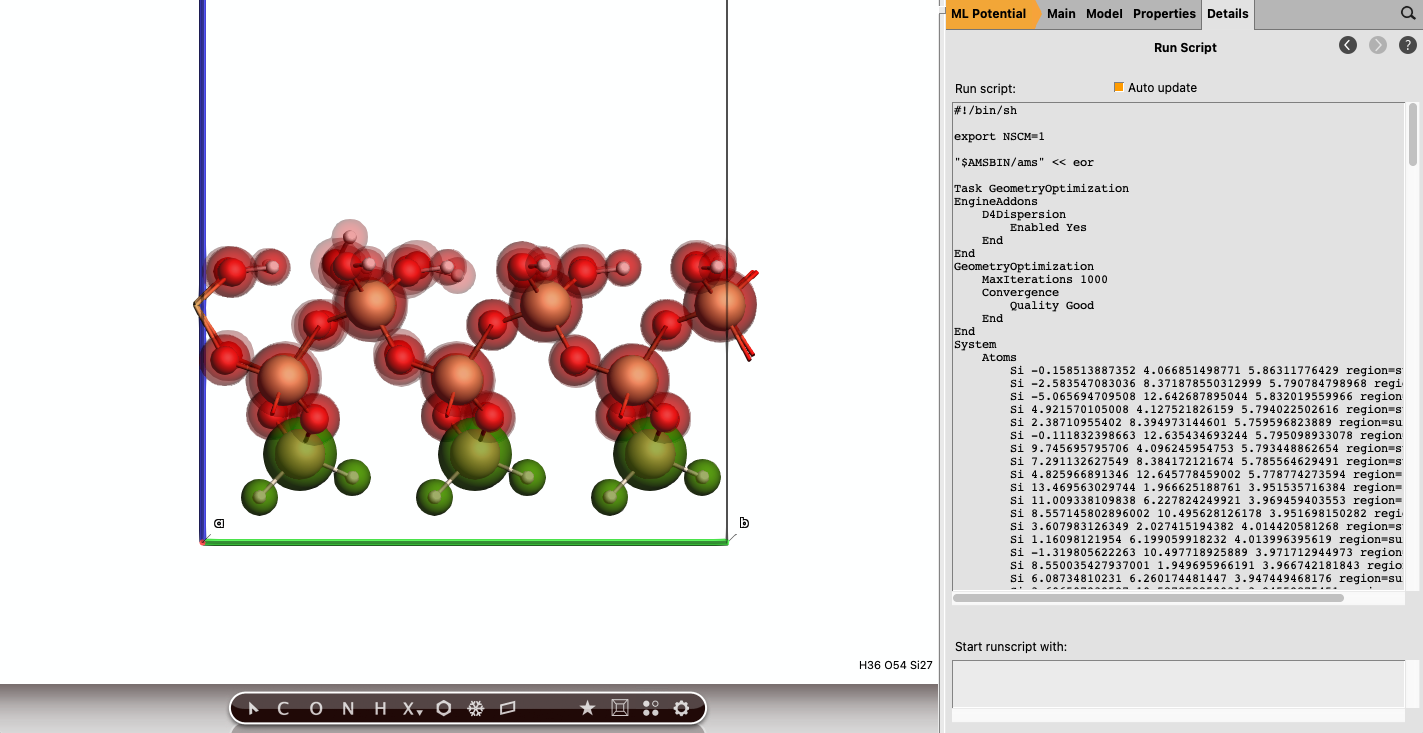
Fig. 34 Run script panel for the silica job. Constraints and engine settings are located after the system block.
Read and combine the adsorption energies
E(candidate_surface_uma) - E(candidate_uma) - E(silica_uma) and multiply by 2625.50 to obtain kJ/mol.candidate_surface_uma in AMSinput and click Update Molecule next to Task to load the optimized coordinates.For this example, we obtain Ebond = -139 kJ/mol and an Al–O distance of 1.98 Å. The negative adsorption energy and short Al–O contact are consistent with favorable coordination at this exposed silanol. They do not establish an ALD reaction pathway or adsorption selectivity.
Explain the interaction with BAND pEDA
Evaluate BAND pEDA at the UMA-relaxed complex geometry. This avoids a separate DFT geometry optimization while allowing the electronic structure of the contact to be analyzed. In contrast, the Figure 3 BAND benchmark was evaluated at the published geometries.
pEDA separates the interaction between fragments held at their geometries in the adsorbed complex:
This interaction energy is not the relaxed adsorption energy. At a consistent electronic-structure level, the latter additionally includes the preparation energies required to deform the separated fragments to their adsorbed geometries. Here, the adsorption and pEDA calculations also use different methods, so their energies must not be subtracted from one another.
Define the two fragments
candidate_surface_uma input, use File → Save As to create candidate_surface_peda. to  . Set Task → Single Point and Periodicity → Slab.
bottom region using its − control, without deleting its atoms. Retain surface (117 atoms) and precursor (22 atoms).0 and a closed-shell, spin-restricted state.The artificial three-dimensional vacuum cell was required by UMA. BAND can
instead treat the slab as two-dimensionally periodic. Removing bottom
avoids introducing an overlapping third fragment. A single-point calculation
does not move any atoms, so optimization constraints are no longer needed.
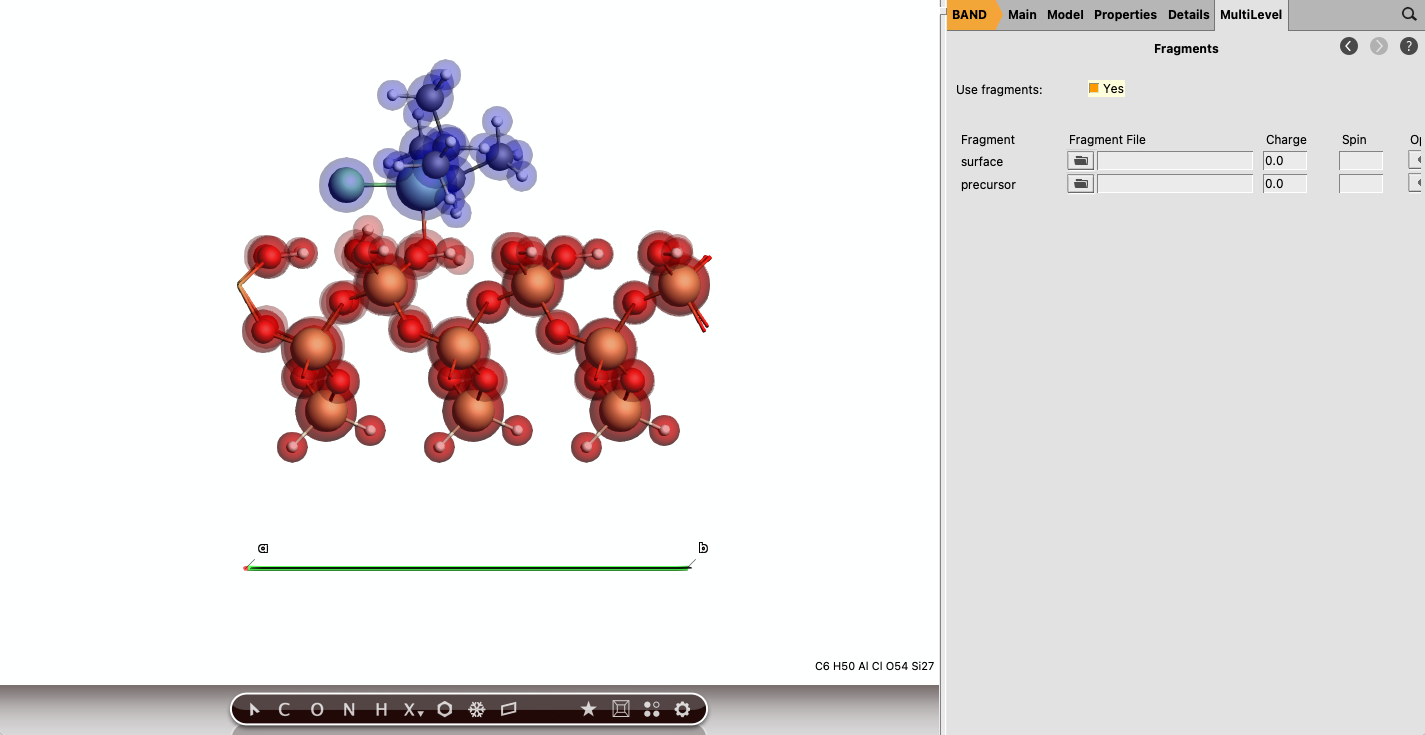
Fig. 35 The two fragments and pEDA settings for BAND.
Run and inspect pEDA
candidate_surface_peda. AMSinput generates the two prepared-fragment calculations and then the full pEDA calculation.The following results are obtained for the candidate at its UMA-relaxed adsorption geometry, using BAND/PBE-D3(BJ)/DZP with Normal numerical quality. A negative contribution favors the interaction; a positive contribution opposes it.
Energy contribution |
Value (kJ/mol) |
Effect |
|---|---|---|
Pauli repulsion (\(\Delta E_\mathrm{Pauli}\)) |
+348.0 |
Repulsive |
Electrostatics (\(\Delta E_\mathrm{elstat}\)) |
-283.6 |
Attractive |
Orbital interaction (\(\Delta E_\mathrm{orb}\)) |
-197.3 |
Attractive |
Dispersion (\(\Delta E_\mathrm{disp}\)) |
-73.1 |
Attractive |
Total interaction (\(\Delta E_\mathrm{int}\)) |
-206.0 |
Net attractive |
The terms close exactly at the reported precision:
The DZP/Normal settings reduce the computational cost of this exercise. The Figure 3 reproduction used TZ2P/Good; rerun the candidate at those settings before making quantitative comparisons with the figure. Keep the fragment and full-system calculations at identical settings. A Gamma-only calculation is suitable for this initial example, but k-point and basis-set convergence should be checked for a new system.
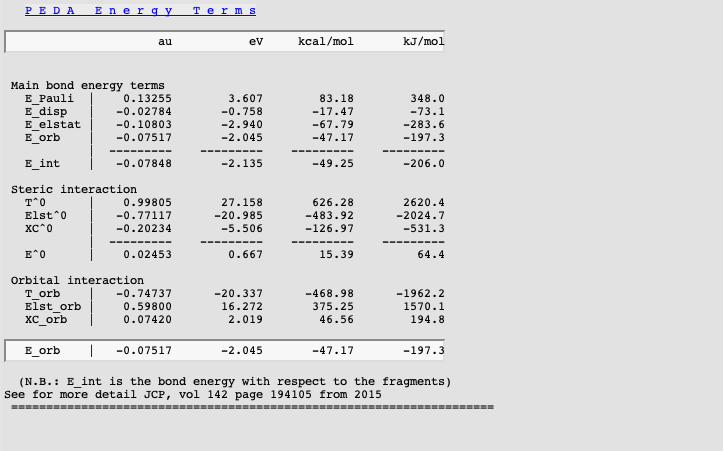
Fig. 36 pEDA resolves the attractive and repulsive contributions at the selected geometry.
The candidate can also be displayed alongside the original precursor series, provided the different computational settings are made explicit.
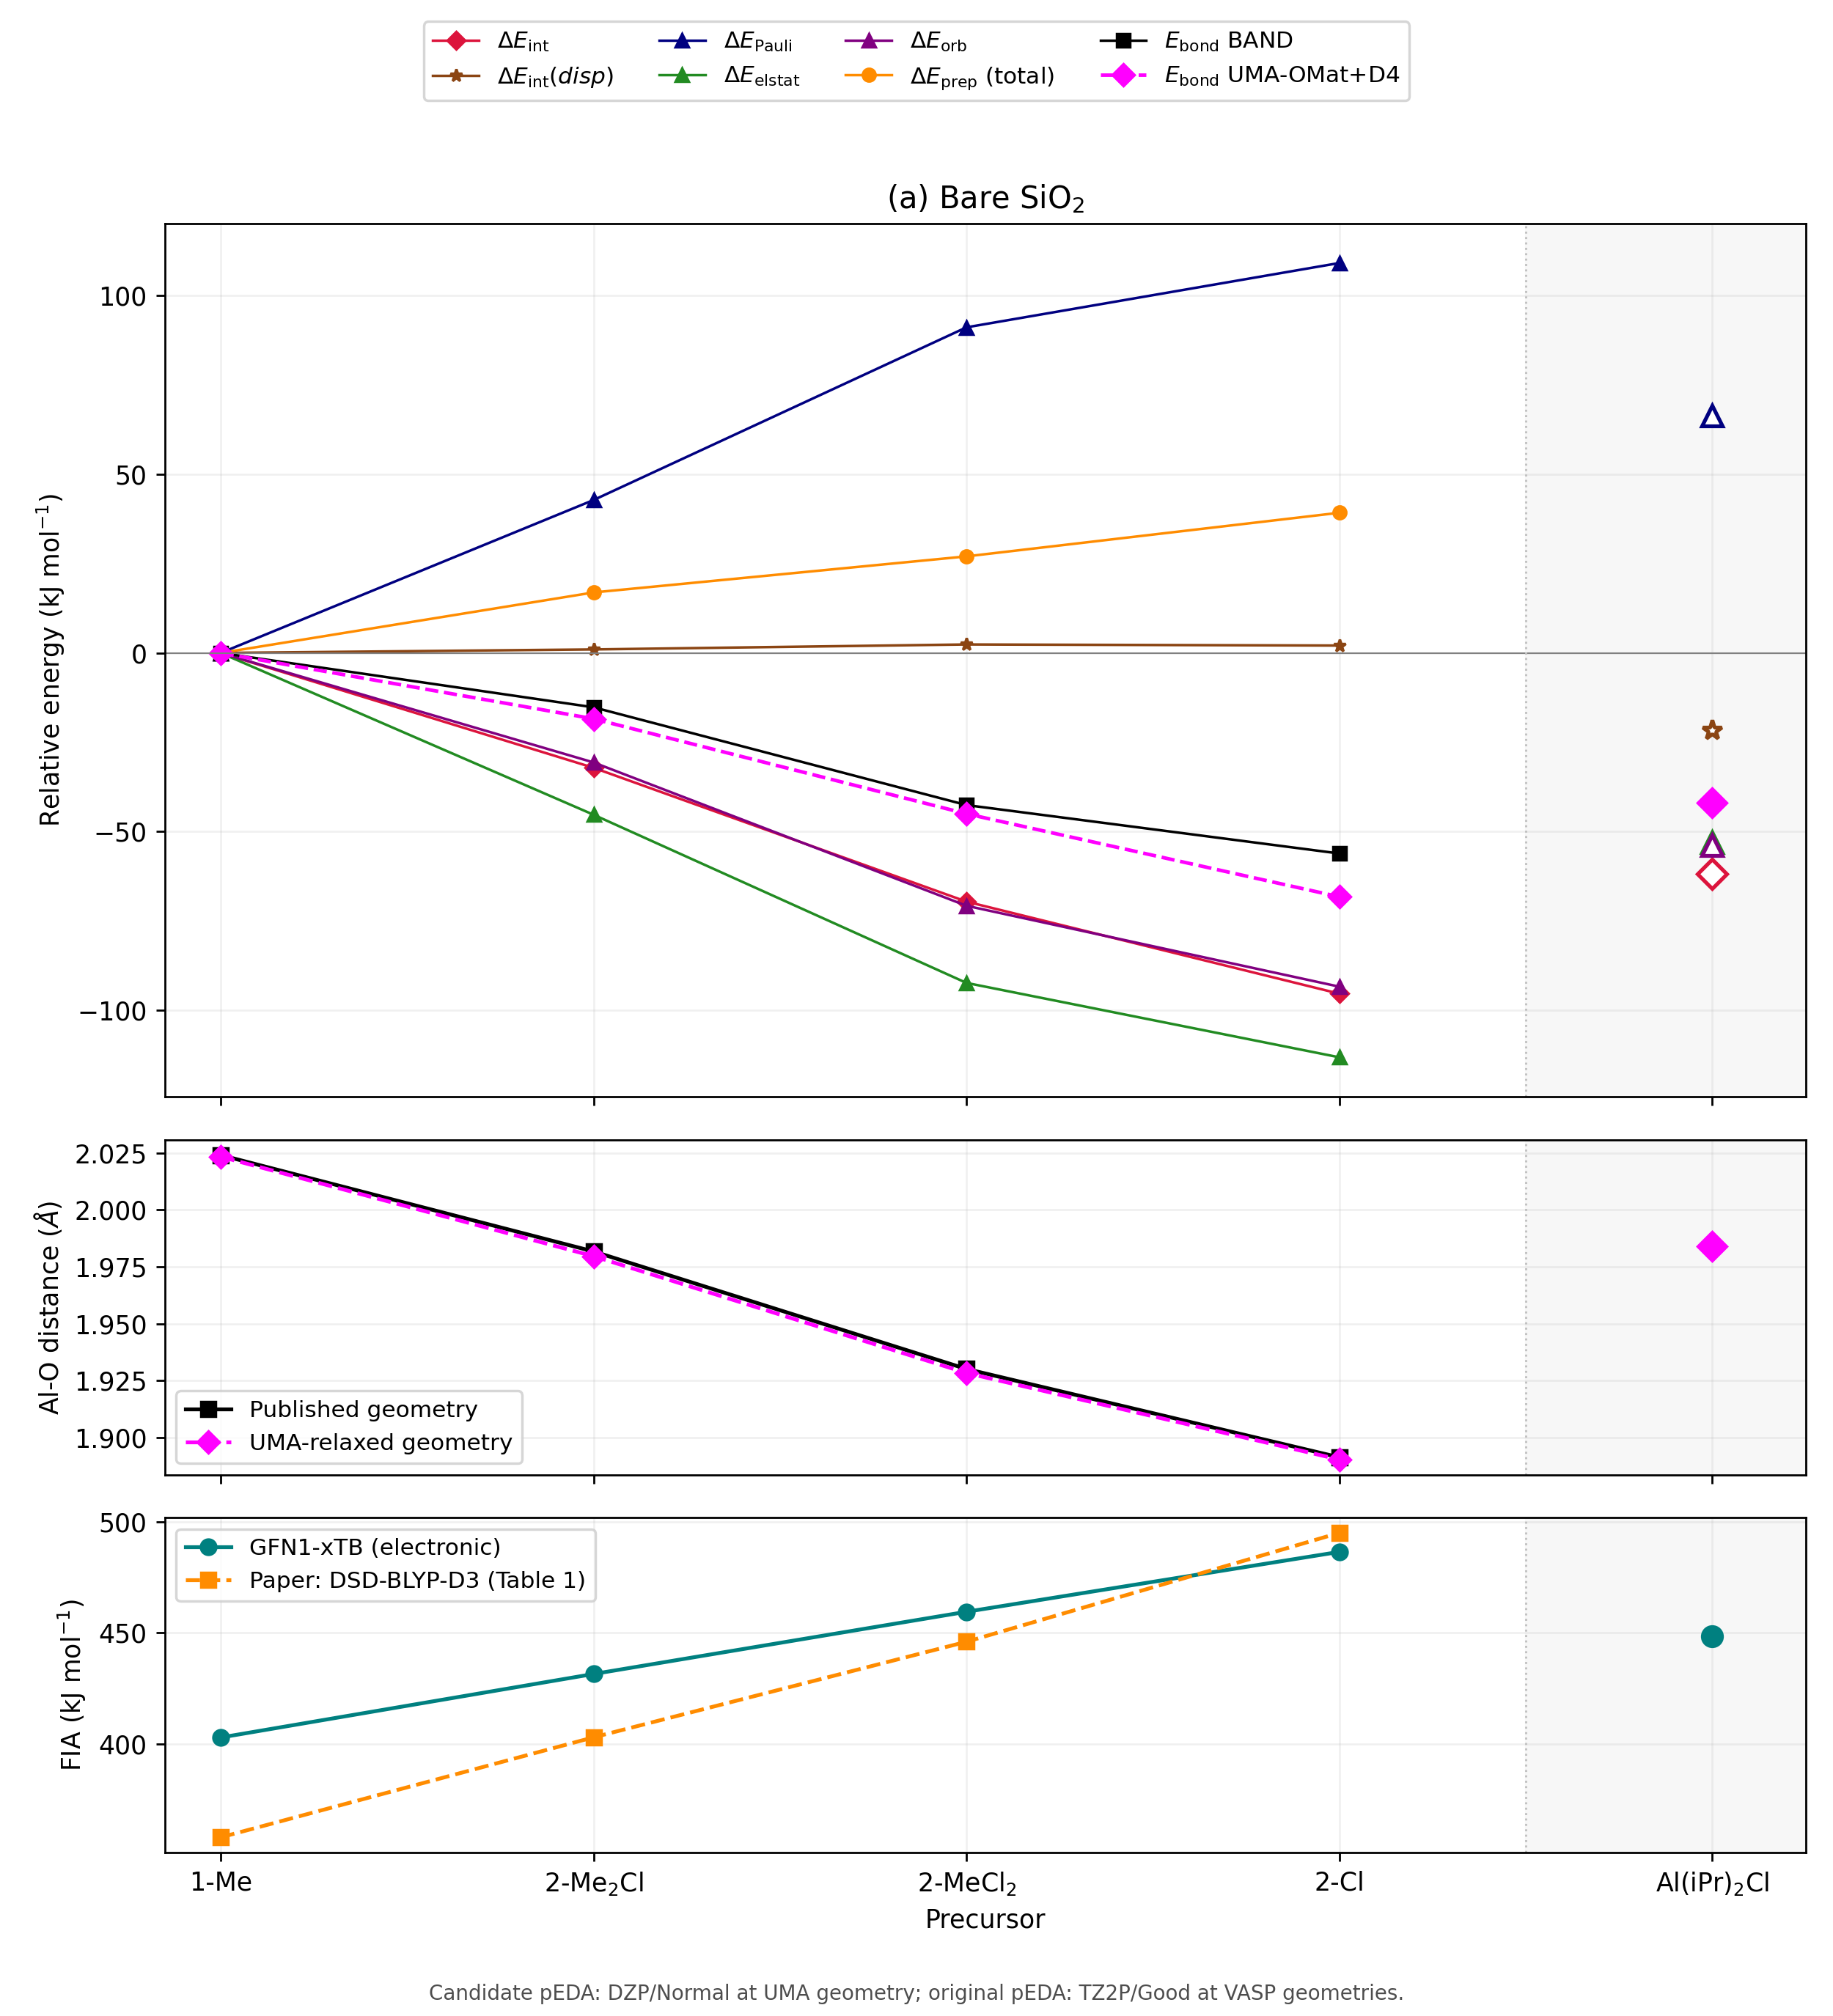
Fig. 37 Illustrative extension of the Figure 3 comparison with the candidate. Recompute all systems consistently before using the extended plot for quantitative rankings.
Caution
The candidate pEDA uses DZP/Normal at a UMA-relaxed geometry, whereas the benchmark BAND calculations used TZ2P/Good at the published geometries. Apparent differences in the extended plot therefore mix changes in precursor chemistry, geometry and computational settings. They are not a controlled comparison.
The pEDA results show a strong electrostatic contribution (-283.6 kJ/mol), followed by orbital interaction (-197.3 kJ/mol) and dispersion (-73.1 kJ/mol). Together these attractions outweigh substantial Pauli repulsion (+348.0 kJ/mol), giving a net interaction of -206.0 kJ/mol at the chosen geometry. Thus, the bulky isopropyl groups do not prevent this monomer from coordinating to an exposed silanol. The absolute Pauli term alone cannot tell us whether steric crowding is larger or smaller than for another precursor: that requires consistent pEDA calculations for the comparison compounds.
Note
Do not add a BAND interaction energy to a UMA preparation energy. To obtain a BAND adsorption energy, evaluate consistently defined isolated BAND references as well. For each fragment, its preparation energy is its BAND energy at the complex geometry minus its BAND energy at the chosen isolated reference geometry. Add both preparation energies to the BAND interaction energy, and state how the isolated geometries were optimized.
What the screening calculation establishes
You have calculated one gas-phase acidity descriptor, one relaxed surface adsorption energy and one decomposition of a specific adsorption contact. There are three xTB jobs, three UMA optimizations, and one pEDA setup that generates three BAND calculations. Several participant energies are needed because FIA and adsorption energy are energy differences, not the energy of a single system.
What do the numbers say about this candidate? The GFN1-xTB electronic FIA of 448 kJ/mol indicates appreciable intrinsic Lewis acidity: at the same computational level, it lies between AlMe2Cl and AlMeCl2. The UMA+D4 adsorption energy of -139 kJ/mol, together with an Al–O distance of 1.98 Å, indicates favorable binding of this monomer to the chosen exposed silanol on bare silica. The BAND pEDA interaction energy of -206 kJ/mol explains how the contact can be stabilized despite strong Pauli repulsion: electrostatic, orbital and dispersion contributions more than compensate for it. These values answer different questions and must not be added to or directly subtracted from one another.
Is it a promising area-selective precursor? It remains a candidate, not a demonstrated selective precursor. Bare silica is the non-growth surface considered in the reference study; favorable adsorption there means that an effective inhibitor layer is important. The present calculation says nothing yet about adsorption on TMPS-modified silica or relative adsorption on the intended growth surface. The bulky groups may help suppress access to inhibitor-covered sites, but that hypothesis is not tested by the bare- silica result. A valid screening comparison should calculate adsorption and pEDA for the candidate and a smaller precursor on both bare and TMPS-modified silica with consistent methods and settings.
These calculations provide a first assessment of the workflow in [1]. The Figure 3 benchmark supports using fast methods to rank the four related compounds, within the limitations discussed above. Before drawing broader conclusions for the new ligand, check higher-level DFT results, multiple precursor conformers and adsorption poses, and the possible role of dimers or other gas-phase species. Adsorption between inhibitor molecules, reaction barriers and finite-temperature effects may also alter selectivity. Fast screening helps prioritize those more demanding studies; it cannot establish an ALD process window or experimental selectivity on its own.