Lattice
The Lattice class defines the lattice structure on which species can bind, diffuse and react. There are several ways to specify the lattice structure. They are defined in a correspondence one-to-one with the conventions used in the Zacros’ input files. See the API section below for a detailed description of these three ways: 1) Default Lattices, 2) Unit-Cell-Defined Periodic Lattices, and 3) Explicitly Defined Custom Lattices.
Following our example (see use case system), we just need a single-site lattice with
a coordination number of 3, a lattice constant equal to 1.0, and a modest number of copies of the unit cell 10x3:
1# Lattice setup
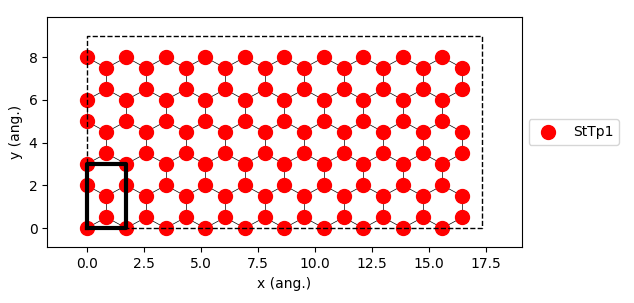
2lat = pz.Lattice( lattice_type=pz.Lattice.TRIANGULAR,
3 lattice_constant=1.0, repeat_cell=[10,3] )
4
5print(lat)
6
7lattice.plot()
The previous lines produce the following output:
lattice default_choice
triangular_periodic 1.0 10 3
end_lattice
In addition to the capabilities of building lattices, pyZacros also offers a way to visualize them by calling
the function plot(). e.g., see line 7 of the script above. This line produces the following figure:
API
- class Lattice(**kwargs)
Lattice class that defines the lattice structure on which species can bind, diffuse and react. As in Zacros’ original input files, there are four different ways of specifying a lattice structure. Below we describe these four ways with the corresponding parameters as well with examples of use.
Default Lattices:
lattice_type– Define the lattice to use. Possible options are:Lattice.TRIANGULAR: Specifies a lattice with coordination number 3. The unit cell is not the primitive cell. The obtained unit cell is a rectangular cell containing 4 sites.Lattice.RECTANGULAR: Specifies a lattice with coordination number 4. The unit cell contains 1 site. The unit cell is the primitive cell.Lattice.HEXAGONAL: Specifies a lattice with coordination number 6. The unit cell is not the primitive cell. The obtained unit cell is a rectangular cell containing 2 sites.
lattice_constant– Defines the lattice constant (in angstrom).repeat_cell– The number of repetitions of the unit cell in the horizontal and vertical.
Example:
lattice = Lattice( lattice_type=Lattice.HEXAGONAL, lattice_constant=1.0, repeat_cell=[4,5] )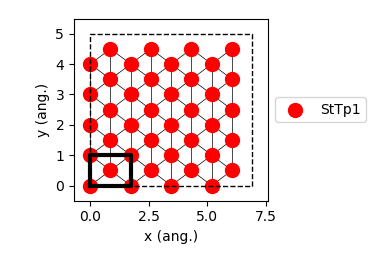
Unit-Cell-Defined Periodic Lattices:
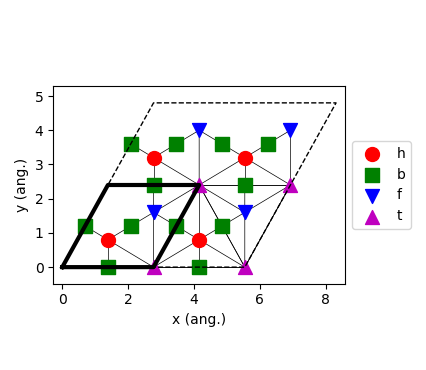
cell_vectors– Define the unit vectors. e.g.[[0.123, 0.000],[1.234,1.234]]repeat_cell– The number of repetitions of the unit cell in the directions of unit vectors. e.g.(10,10)site_types– The names of the different site types. e.g.[ "cn2", "br42", "cn2" ]site_coordinates– Pairs of real numbers specifying the “fractional coordinates” of each site in the unit cell. e.g.[ (0.123,0.894), (0.456,0.123) ]neighboring_structure– Defines a neighboring structure block. e.g.[ ((0,0),Lattice.NORTH), ((0,1),Lattice.NORTHEAST) ]
Example:
lattice = Lattice( cell_vectors=[[2.77185866, 0.00000000],[1.38592933, 2.40050002]],
                   repeat_cell=[2, 2],
                   site_types=["b", "h", "b", "b", "f", "t"],
                   site_coordinates=[[0.00001, 0.49999],
                                     [0.33333, 0.33333],
                                     [0.49999, 0.00001],
                                     [0.49999, 0.49999],
                                     [0.66667, 0.66667],
                                     [0.99999, 0.00001]],
                   neighboring_structure=[ [(0,1), Lattice.SELF],
                                           [(1,2), Lattice.SELF],
                                           [(1,3), Lattice.SELF],
                                           [(3,4), Lattice.SELF],
                                           [(4,2), Lattice.NORTH],
                                           [(4,0), Lattice.EAST],
                                           [(5,5), Lattice.NORTH],
                                           [(5,5), Lattice.EAST],
                                           [(5,4), Lattice.SELF],
                                           [(5,1), Lattice.SELF],
                                           [(5,1), Lattice.EAST],
                                           [(5,4), Lattice.SOUTHEAST],
                                           [(5,1), Lattice.SOUTHEAST],
                                           [(4,5), Lattice.NORTH],
                                           [(5,5), Lattice.SOUTHEAST] ] )
Explicitly Defined Custom Lattices:
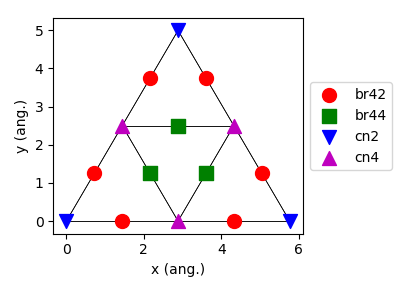
site_types– The names of the different site types. e.g.[ "cn2", "br42" ]site_coordinates– Pairs of real numbers specifying the “fractional coordinates” of each site in the unit cell. e.g.[ (0.123,0.894), (0.456,0.123) ]nearest_neighbors– Defines the neighboring structure. e.g.[ (2,6), (2,4,7,8) ]cell_vectors– Define the unit vectors. Optional
Example:
lattice = Lattice( site_types=["cn2", "br42", "cn4", "br42", "cn2", "br42",
                                  "br44", "br44", "br42", "cn4", "br44", "cn4",
                                  "br42", "br42", "cn2"],
                   site_coordinates=[[0.0000e+0, 0.0000e+0],
                                     [1.4425e+0, 0.0000e+0],
                                     [2.8850e+0, 0.0000e+0],
                                     [4.3275e+0, 0.0000e+0],
                                     [5.7700e+0, 0.0000e+0],
                                     [7.2125e-1, 1.2492e+0],
                                     [2.1637e+0, 1.2492e+0],
                                     [3.6062e+0, 1.2492e+0],
                                     [5.0487e+0, 1.2492e+0],
                                     [1.4425e+0, 2.4985e+0],
                                     [2.8850e+0, 2.4985e+0],
                                     [4.3275e+0, 2.4985e+0],
                                     [2.1637e+0, 3.7477e+0],
                                     [3.6062e+0, 3.7477e+0],
                                     [2.8850e+0, 4.9970e+0]],
                   nearest_neighbors=[[ 1,  5],
                                      [ 0,  2],
                                      [ 1,  3,  6, 7],
                                      [ 2,  4],
                                      [ 3,  8],
                                      [ 0,  9],
                                      [ 2,  9],
                                      [ 2, 11],
                                      [ 4, 11],
                                      [ 5,  6, 10, 12],
                                      [ 9, 11],
                                      [ 7,  8, 10, 13],
                                      [ 9, 14],
                                      [11, 14],
                                      [12, 13]] )
From a Zacros input file:
fileName– Path to the zacros file name, typicallylattice_input.dat
Example:
lattice = Lattice( fileName='mypath/lattice_input.dat' )- __fromZacrosFile(fileName)
Creates a Lattice from a Zacros input file lattice_input.dat
- add_site_type(site_type, coordinates, precision=0.01)
Adds a new site only if this is not already included in the lattice. It returns the id of the site
site_type– Site type name, e.g. ‘StTp1’coordinates– 2D vector representing the site position, e.g. [0.0, 0.5]precision– Precision used to determine (based on the coordinates) if the site is alreadyor not contained on the list of sites. Default: 0.01
- add_nearest_neighbor(id_site, id_neighbor)
Adds a new nearest-neighbor item to the lattice, e.g. (1,3)
id_site– Site id, e.g. 1id_neighbor– id of the new site neighbor, e.g. 3
- extend(other, precision=0.1, cell_vectors_precision=0.01)
Extends the sites and corresponding neighboring information by appending the equivalent items from another lattice.
other– Lattice to appendprecision– Precision used to determine (based on the coordinates) if the site is already or not contained on the list of sites. Default: 0.1cell_vectors_precision– Precision used to determine cell_vectors are the same or not. Default: 0.01
- plot(pause=-1, show=True, color=None, ax=None, close=False, show_sites_ids=False, file_name=None, markers=None, marker_size=1.0, colors=None)
Uses Matplotlib to visualize the lattice. Be sure that Matplotlib is installed in your system; otherwise, the function does nothing.
pause– After showing the figure, it will waitpause-seconds before refreshing. This can be used for crude animation.show– Enables showing the figure on the screen.color– Uses the same color for both binding sites and connections; e.g. ‘k’. See matplotlib.colors.ax– The axes of the plot. It contains most of the figure elements: Axis, Tick, Line2D, Text, Polygon, etc., and sets the coordinate system. See matplotlib.axes.close– Closes the figure window after pause time.show_sites_ids– Shows the binding sites id on the figure.file_name– Saves the figure to the filefile_name. The format is inferred from the extension, and by default,.pngis used.markers– List of marker styles used for site types.marker_size– Scale factor for marker area.colors– List of colors used for site types whencoloris not set.
- number_of_sites()
Returns the total number of sites
- site_types_set()
Returns the set of the sites types
- set_repeat_cell(repeat_cell)
Set the parameter repeat_cell and update all internal information
repeat_cell– The number of repetitions of the unit cell in the directions of unit vectors. e.g.(10,10)
- replace_site_types(site_types_old, site_types_new)
Replaces the site types names
site_types_old– List of strings containing the old site_types to be replacedsite_types_new– List of strings containing the new site_types which would replace old site_types_old.