Distribution of species in multispecies calculations
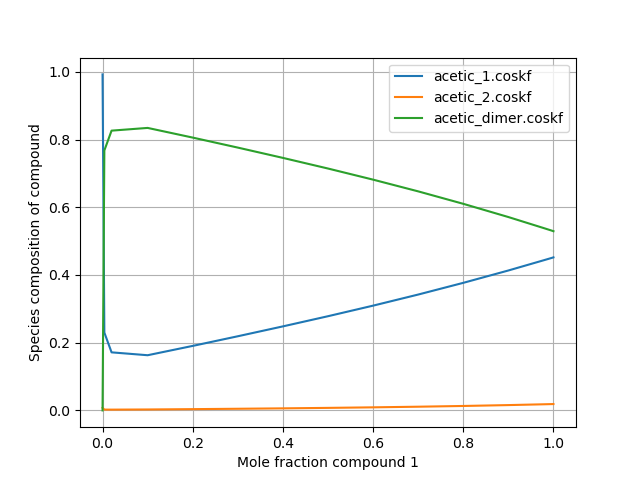
COSMO-RS can be used with compounds which can be composed of multiple possible species . For these types of calculations, it is often desirable to know the distribution of the various possible forms/species that constitute a certain compound. In the following script, a binary mixture calculation is performed using benzene and an acetic acid compound which is capable of existing as either of 2 conformers or as a dimer. The distribution of these species is plotted as a function of mole fraction.
Python code (Binary mixture)
[show/hide code]
import os
import matplotlib.pyplot as plt
from scm.plams import *

##################  Note: Be sure to add the path to your own AMSCRS directory here  ##################
database_path = os.getcwd()

if not os.path.exists(database_path):
    raise OSError(f'The provided path does not exist. Exiting.')

def adjust_name(s):
    return os.path.basename(s)

init()
#suppress plams output
config.log.stdout = 0

# initialize settings object
settings = Settings()
settings.input.property._h = 'BINMIXCOEF'
# optionally, change to the COSMOSAC2013 method
# settings.input.method = 'COSMOSAC2013'

# set the number of compounds
num_compounds = 2
compounds = [Settings() for i in range(num_compounds)]

compounds[1].name = "acetic_acid"
form = [Settings() for i in range(3)]

form[0]._h = os.path.join( database_path, "acetic_1.coskf" )

form[1]._h = os.path.join( database_path, "acetic_2.coskf" )

form[2]._h = os.path.join( database_path, "acetic_dimer.coskf" )
form[2].count = 2
form[2].Hcorr = 9.25

compounds[0].form = form

compounds[1]._h = os.path.join( database_path, "Benzene.coskf" )
compounds[1].name = "comp1"

settings.input.temperature = 298.15

# specify the compounds as the compounds to be used in the calculation
settings.input.compound = compounds
# create a job that can be run by COSMO-RS
my_job = CRSJob(settings=settings)
# run the job
out = my_job.run()

# convert all the results into a python dict
res = out.get_results()

struct_names = res['struct names'].split()
valid_structs = [[] for _ in range(len(compounds))]
for i in range(len(struct_names)):
    for j in range(len(compounds)):
        if res['valid structs'][i*len(compounds)+j]:
            valid_structs[j].append(struct_names[i])

compositions = [ {vs:[] for vs in valid_structs[i]} for i in range(len(compounds)) ]
idx = 0
for i in range(len(compounds)):
    for nfrac in range(len(res['molar fraction'][0])):
        for j in range(len(valid_structs[i])):
            compositions[i][valid_structs[i][j]].append(res['comp distribution'][idx])
            idx += 1


mf1 = res['molar fraction'][0]

plot_comp = 0 # we'll plot the first compound (acetic acid)
for struct, vals in compositions[plot_comp].items():
    plt.plot(mf1,vals,label=adjust_name(struct))

plt.xlabel("Mole fraction compound 1")
plt.ylabel("Species composition of compound")
plt.legend(loc='upper right')
plt.grid()
plt.show()

finish()
This code produces the following output: