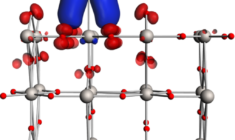
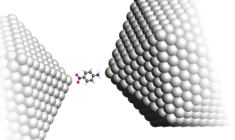
Powerful Graphical User Interface

Making computational chemistry easy: set up and visualize from DFT to reactive MD.
Fully integrated, single-file install, running on Linux, Windows and MacOS

Get your free trial
or see other products in the Amsterdam Modeling Suite

Graphical User Interface

Integrated GUI for easy set up & visualization

  • Easy to set up, run & visualize
    • Build molecules, periodic systems or polymers and import structures
    • Cross-platform job management and visualization
    • Molecular orbitals, densities and related properties, (p)DOS, band structures, spectra, movies
  • Hassle-free installation
  • Integrated with all modules in the Amsterdam Modeling Suite and an interface to VASP and Quantum ESPRESSO
    • Molecular DFT, periodic DFT, semi-empirical, ReaxFF and COSMO-RS in one package with one GUI
  • Seamless from cluster to periodic and vice versa

Selected Highlights

Useful new features in the AMS2020 GUI
Watch our developer Olivier Visser demonstrate some useful new features of the AMS2020 GUI:

  • export coordinates in different formats
  • visualize results: geometry optimization, orbital level diagrams, charges…
  • new options for molecular dynamics trajectory analysis

Polymer Builder
GUI developer Laurens Groot demonstrates how to build linear, branched polymers and co-polymers and use them to pack periodic boxes.
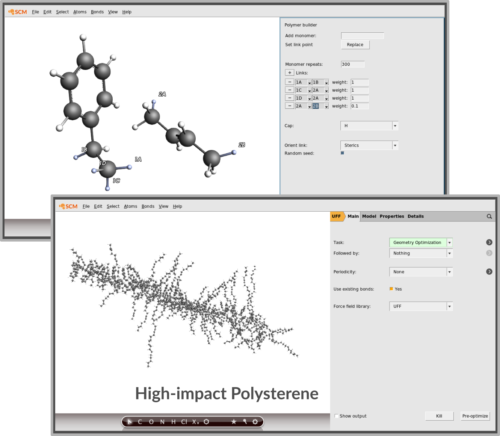
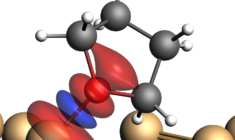
polymer builder

Our GUI works out of the box with all the computational chemistry engines in the Amsterdam Modeling Suite. While researchers may still use the command-line mode if desired, most standard and advanced calculation options are straightforwardly set up in the GUI. Jobs can be submitted, monitored and analyzed cross-platform without needing to convert file formats.

To create the system you want to study, use our internal library of molecules and periodic systems, import popular structure formats (xyz, pdb, SMILES, cif), and make use of the excellent building tools in the GUI to add structural elements, slice surfaces, or fill a box with molecules. Step-by-step tutorials guide you through a range of capabilities which are easily set up  and analyzed with the graphical interface. You can literally visualize the results of your first calculation within minutes after downloading.