Hydrogen Bonds from MD
This example runs a short molecular-dynamics simulation of liquid water, then computes hydrogen-bond statistics from the generated trajectory.
Hydrogen bonds are detected with the SCM Python/FlexMD criteria (X1-H—X2 pattern) and summarized as a normalized histogram of the number of hydrogen bonds per selected atom.
Hydrogen Bonds from MD
Initial imports
import os
from io import StringIO

import matplotlib.pyplot as plt
import numpy as np
from scm.flexmd import PDBMolecule
from scm.plams import AMSJob, RKFTrajectoryFile, Settings, from_smiles, packmol, view
Run Short MD Simulation
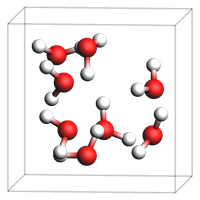
mol = packmol(from_smiles("O"), n_molecules=8, density=1.0)

settings = Settings()
settings.input.ams.Task = "MolecularDynamics"
settings.input.ams.MolecularDynamics.NSteps = 200
settings.input.ams.MolecularDynamics.TimeStep = 0.5
settings.input.ams.MolecularDynamics.InitialVelocities.Temperature = 300
settings.input.ams.MolecularDynamics.Trajectory.SamplingFreq = 1
settings.input.ReaxFF.ForceField = "Water2017.ff"
settings.runscript.nproc = 1
os.environ["OMP_NUM_THREADS"] = "1"

job = AMSJob(settings=settings, molecule=mol)
job.run();
[31.03|12:27:35] JOB plamsjob STARTED
[31.03|12:27:35] JOB plamsjob RUNNING
[31.03|12:27:36] JOB plamsjob FINISHED
[31.03|12:27:36] JOB plamsjob SUCCESSFUL
view(mol, direction="tilt_z", width=200, height=200, padding=-1)
Hydrogen-bond analysis helpers
def collect_hbond_counts(filename, indices=None, elements=None):
    indices = [] if indices is None else list(indices)
    elements = {"O"} if elements is None else set(elements)

    rkf = RKFTrajectoryFile(filename)
    mol = rkf.get_plamsmol()

    for i, at in enumerate(mol.atoms):
        if at.symbol in elements and i not in indices:
            indices.append(i)

    f = StringIO()
    mol.writexyz(f)
    f.seek(0)
    pdb = PDBMolecule(xyzstring=f.read(), bonddetectorflag=False)
    f.close()

    heavy_atoms = [i for i, at in enumerate(mol.atoms) if at.symbol != "H"]
    hydrogens = [i for i, at in enumerate(mol.atoms) if at.symbol == "H"]

    values = []
    for istep in range(len(rkf)):
        crd, cell = rkf.read_frame(istep, molecule=mol)
        d_indices, boxlist = pdb.divide_into_cubes(range(len(mol)))
        pdb.coords = crd
        pdb.set_cellvectors(cell)

        for iat in indices:
            atomlists = (heavy_atoms, hydrogens)
            atoms, hs = pdb.find_neighbours_using_cubes(iat, d_indices, boxlist, atomlists)
            hbonds = pdb.get_hbonds(iat, atoms, hs)
            values.append(len(hbonds))

    rkf.close()
    return values


def normalized_histogram(values):
    xvalues = np.arange(max(values) + 1, dtype=float)
    yvalues = np.bincount(values, minlength=len(xvalues))
    return xvalues, yvalues / float(len(values))
Analyze trajectory and save histogram
values = collect_hbond_counts(job.results.rkfpath(), elements={"O"})
xvalues, yfrac = normalized_histogram(values)

with open("hist.txt", "w") as outfile:
    for x, y in zip(xvalues, yfrac):
        outfile.write(f"{x:20.10f} {y:20.10f}\n")

print("Wrote normalized histogram to hist.txt")
Wrote normalized histogram to hist.txt
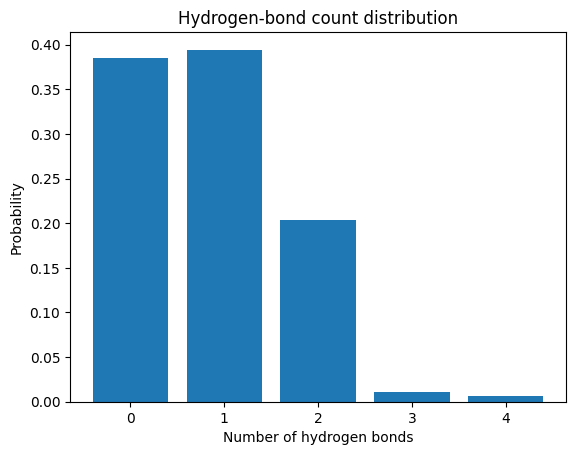
Plot the hydrogen-bond distribution
fig, ax = plt.subplots()
ax.bar(xvalues, yfrac, width=0.8, align="center")
ax.set_xlabel("Number of hydrogen bonds")
ax.set_ylabel("Probability")
ax.set_title("Hydrogen-bond count distribution")
ax.set_xticks(xvalues)
ax;
See also
Python Script
#!/usr/bin/env python
# coding: utf-8

# ## Hydrogen Bonds from MD

# ### Initial imports

import os
from io import StringIO

import matplotlib.pyplot as plt
import numpy as np
from scm.flexmd import PDBMolecule
from scm.plams import AMSJob, RKFTrajectoryFile, Settings, from_smiles, packmol, view


# ### Run Short MD Simulation

mol = packmol(from_smiles("O"), n_molecules=8, density=1.0)

settings = Settings()
settings.input.ams.Task = "MolecularDynamics"
settings.input.ams.MolecularDynamics.NSteps = 200
settings.input.ams.MolecularDynamics.TimeStep = 0.5
settings.input.ams.MolecularDynamics.InitialVelocities.Temperature = 300
settings.input.ams.MolecularDynamics.Trajectory.SamplingFreq = 1
settings.input.ReaxFF.ForceField = "Water2017.ff"
settings.runscript.nproc = 1
os.environ["OMP_NUM_THREADS"] = "1"

job = AMSJob(settings=settings, molecule=mol)
job.run()
view(mol, direction="tilt_z", width=200, height=200, padding=-1, picture_path="picture1.png")


# ### Hydrogen-bond analysis helpers


def collect_hbond_counts(filename, indices=None, elements=None):
    indices = [] if indices is None else list(indices)
    elements = {"O"} if elements is None else set(elements)

    rkf = RKFTrajectoryFile(filename)
    mol = rkf.get_plamsmol()

    for i, at in enumerate(mol.atoms):
        if at.symbol in elements and i not in indices:
            indices.append(i)

    f = StringIO()
    mol.writexyz(f)
    f.seek(0)
    pdb = PDBMolecule(xyzstring=f.read(), bonddetectorflag=False)
    f.close()

    heavy_atoms = [i for i, at in enumerate(mol.atoms) if at.symbol != "H"]
    hydrogens = [i for i, at in enumerate(mol.atoms) if at.symbol == "H"]

    values = []
    for istep in range(len(rkf)):
        crd, cell = rkf.read_frame(istep, molecule=mol)
        d_indices, boxlist = pdb.divide_into_cubes(range(len(mol)))
        pdb.coords = crd
        pdb.set_cellvectors(cell)

        for iat in indices:
            atomlists = (heavy_atoms, hydrogens)
            atoms, hs = pdb.find_neighbours_using_cubes(iat, d_indices, boxlist, atomlists)
            hbonds = pdb.get_hbonds(iat, atoms, hs)
            values.append(len(hbonds))

    rkf.close()
    return values


def normalized_histogram(values):
    xvalues = np.arange(max(values) + 1, dtype=float)
    yvalues = np.bincount(values, minlength=len(xvalues))
    return xvalues, yvalues / float(len(values))


# ### Analyze trajectory and save histogram

values = collect_hbond_counts(job.results.rkfpath(), elements={"O"})
xvalues, yfrac = normalized_histogram(values)

with open("hist.txt", "w") as outfile:
    for x, y in zip(xvalues, yfrac):
        outfile.write(f"{x:20.10f} {y:20.10f}\n")

print("Wrote normalized histogram to hist.txt")


# ### Plot the hydrogen-bond distribution

fig, ax = plt.subplots()
ax.bar(xvalues, yfrac, width=0.8, align="center")
ax.set_xlabel("Number of hydrogen bonds")
ax.set_ylabel("Probability")
ax.set_title("Hydrogen-bond count distribution")
ax.set_xticks(xvalues)
ax
ax.figure.savefig("picture2.png")