
Molecule and Bond Counts from Reactive MD
Run a short reactive molecular dynamics simulation with ReaxFF and tabulate the time evolution of molecule and bond-type counts from the generated trajectory.
Molecule and Bond Counts from Reactive MD
This example performs molecule and bond counting from a reactive MD trajectory. It first runs a short ReaxFF simulation, then plots molecule populations versus time and bond counts per frame from the generated ams.rkf.
The MD run requires a ReaxFF license. If you already have a reactive MD trajectory with molecule data, you can skip the MD cell and set ams_rkf_path to your own file.
Initial Imports
from collections import Counter
from pathlib import Path
from typing import Dict, List, Literal, Optional, Sequence, Set, Tuple

import matplotlib.pyplot as plt
from matplotlib.axes import Axes
from scm.inputs import AMS, ReaxFF
from scm.plams import AMSJob, Trajectory, from_smiles, packmol, view, Settings
from scm.plams.tools.plot import plot_molecule_counts
Run a short reactive MD simulation
This produces an ams.rkf trajectory with molecule and bond information for analysis.
o2 = from_smiles("O=O")
h2 = from_smiles("[HH]")
mixture = packmol(molecules=[o2, h2], n_molecules=[4, 4], density=1.0)
view(mixture, direction="tilt_z", width=300, height=300)

md_settings = Settings()
md_settings.input = AMS(Task="MolecularDynamics")
md_settings.input.Engine = ReaxFF(ForceField="CHO.ff")
md_settings.input.MolecularDynamics.NSteps = 3000
md_settings.input.MolecularDynamics.TimeStep = 0.5
md_settings.input.MolecularDynamics.InitialVelocities.Temperature = 3500
md_settings.input.MolecularDynamics.Trajectory.WriteMolecules = True
md_settings.input.MolecularDynamics.Trajectory.WriteBonds = True
md_settings.runscript.nproc = 1
md_settings.runscript.preamble_lines = ["export OMP_NUM_THREADS=1"]

md_job = AMSJob(name="reactive_md_toy", settings=md_settings, molecule=mixture)
md_results = md_job.run();
[18:14:08] WARNING: not removing hydrogen atom without neighbors
[18:14:08] WARNING: not removing hydrogen atom without neighbors


[09.10|18:14:11] JOB reactive_md_toy STARTED
[09.10|18:14:11] JOB reactive_md_toy RUNNING
[09.10|18:14:13] JOB reactive_md_toy FINISHED
[09.10|18:14:13] JOB reactive_md_toy SUCCESSFUL
Molecule populations versus time
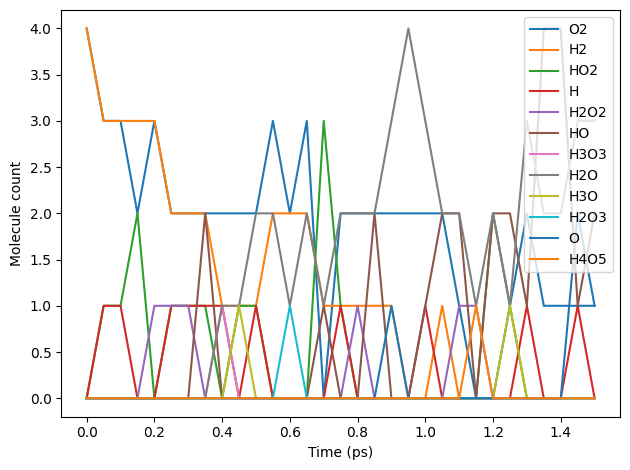
plot_molecule_counts reads the molecule analysis from ams.rkf and plots the population of every detected molecular formula against time. Pass species=["H2", "O2"] to plot only selected formulas, or set x_axis="frame" to use trajectory frames instead.
ax = plot_molecule_counts(md_job, time_unit="ps")
ax.figure.tight_layout()
ax;
Extract the molecule populations
get_molecule_count_history returns frame indices, MD times in fs, and a dictionary containing one array per requested formula. Here they are converted to a table for further analysis or export.
import pandas as pd

frames, time_fs, molecule_population_history = md_job.results.get_molecule_count_history(
    species=["H2", "O2", "H2O"]
)
molecule_populations = pd.DataFrame({"frame": frames, "time_fs": time_fs, **molecule_population_history})
molecule_populations
frame | time_fs | H2 | O2 | H2O | |
|---|---|---|---|---|---|
0 | 1 | 0.0 | 4 | 4 | 0 |
1 | 2 | 50.0 | 3 | 3 | 0 |
2 | 3 | 100.0 | 3 | 3 | 0 |
3 | 4 | 150.0 | 3 | 2 | 0 |
4 | 5 | 200.0 | 3 | 3 | 0 |
5 | 6 | 250.0 | 2 | 2 | 0 |
6 | 7 | 300.0 | 2 | 2 | 0 |
7 | 8 | 350.0 | 2 | 2 | 0 |
8 | 9 | 400.0 | 1 | 2 | 1 |
9 | 10 | 450.0 | 1 | 2 | 1 |
10 | 11 | 500.0 | 1 | 2 | 2 |
11 | 12 | 550.0 | 2 | 3 | 2 |
12 | 13 | 600.0 | 2 | 2 | 1 |
13 | 14 | 650.0 | 2 | 3 | 2 |
14 | 15 | 700.0 | 1 | 0 | 1 |
15 | 16 | 750.0 | 1 | 2 | 2 |
16 | 17 | 800.0 | 1 | 2 | 2 |
17 | 18 | 850.0 | 1 | 2 | 2 |
18 | 19 | 900.0 | 1 | 2 | 3 |
19 | 20 | 950.0 | 0 | 2 | 4 |
20 | 21 | 1000.0 | 0 | 2 | 3 |
21 | 22 | 1050.0 | 1 | 2 | 2 |
22 | 23 | 1100.0 | 0 | 1 | 2 |
23 | 24 | 1150.0 | 0 | 0 | 1 |
24 | 25 | 1200.0 | 0 | 0 | 2 |
25 | 26 | 1250.0 | 0 | 1 | 1 |
26 | 27 | 1300.0 | 0 | 2 | 3 |
27 | 28 | 1350.0 | 0 | 1 | 2 |
28 | 29 | 1400.0 | 0 | 1 | 2 |
29 | 30 | 1450.0 | 0 | 1 | 3 |
30 | 31 | 1500.0 | 0 | 1 | 3 |
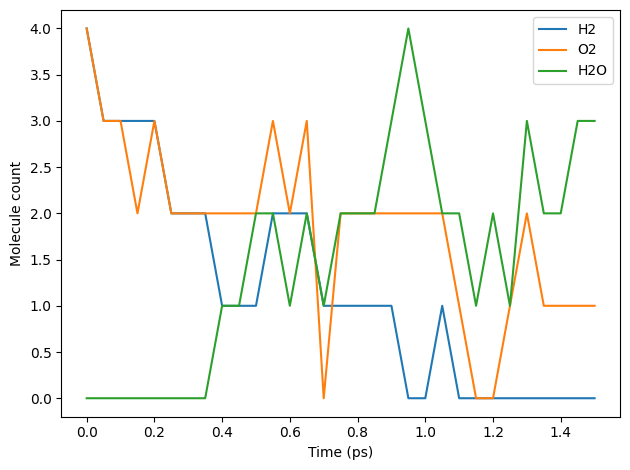
To focus on selected species, pass their molecular formulas with the species argument.
ax = plot_molecule_counts(md_job, species=["H2", "O2", "H2O"], time_unit="ps")
ax.figure.tight_layout()
ax;
Bond counts per frame
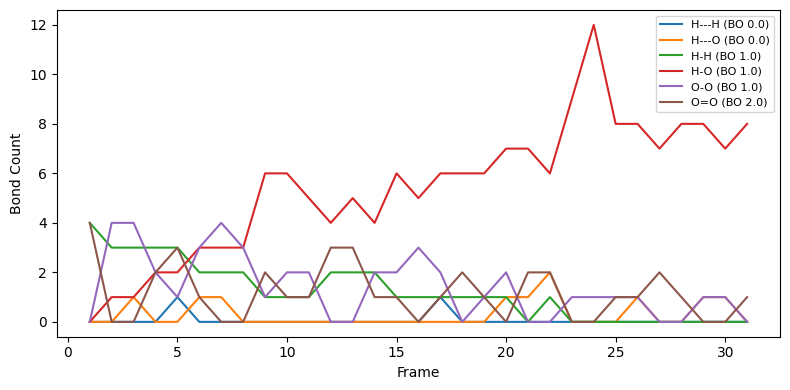
Count bond types per frame, using bond order rounded to either integer or half-integer values.
import pandas as pd

trajectory = Trajectory(md_job.results.rkfpath())
n_frames = len(trajectory)


def bo_to_symbol(bo):
    s = "---"
    if bo == 0.5:
        s = "--"
    if bo == 1.0:
        s = "-"
    if bo == 1.5:
        s = "=="
    if bo == 2.0:
        s = "="
    if bo == 2.5:
        s = "≡≡"
    if bo == 3.0:
        s = "≡"
    return s


all_bonds = {}
for frame_index, mol in enumerate(trajectory):
    frame_counts: Counter = Counter()
    seen_pairs: Set[Tuple[int, int]] = set()

    for bond in mol.bonds:
        pair = tuple(sorted((mol.index(bond.atom1), mol.index(bond.atom2))))
        if pair in seen_pairs:
            continue
        seen_pairs.add(pair)

        symbols = sorted((bond.atom1.symbol, bond.atom2.symbol))
        bo = float(round(bond.order))
        label = f"{symbols[0]}{bo_to_symbol(bo)}{symbols[1]} (BO {bo:.1f})"
        frame_counts[label] += 1

    for label, count in frame_counts.items():
        if label not in all_bonds:
            all_bonds[label] = [0] * n_frames
        all_bonds[label][frame_index] = int(count)

bond_names = sorted(all_bonds.keys())
bond_counts = []
for frame_index in range(n_frames):
    counts = {"Frame": frame_index + 1}
    for name in bond_names:
        counts[name] = all_bonds[name][frame_index]
    bond_counts.append(counts)

bond_counts_df = pd.DataFrame(bond_counts)
bond_counts_df
Frame | H—H (BO 0.0) | H—O (BO 0.0) | H-H (BO 1.0) | H-O (BO 1.0) | O-O (BO 1.0) | O=O (BO 2.0) | |
|---|---|---|---|---|---|---|---|
0 | 1 | 0 | 0 | 4 | 0 | 0 | 4 |
1 | 2 | 0 | 0 | 3 | 1 | 4 | 0 |
2 | 3 | 0 | 1 | 3 | 1 | 4 | 0 |
3 | 4 | 0 | 0 | 3 | 2 | 2 | 2 |
4 | 5 | 1 | 0 | 3 | 2 | 1 | 3 |
5 | 6 | 0 | 1 | 2 | 3 | 3 | 1 |
6 | 7 | 0 | 1 | 2 | 3 | 4 | 0 |
7 | 8 | 0 | 0 | 2 | 3 | 3 | 0 |
8 | 9 | 0 | 0 | 1 | 6 | 1 | 2 |
9 | 10 | 0 | 0 | 1 | 6 | 2 | 1 |
10 | 11 | 0 | 0 | 1 | 5 | 2 | 1 |
11 | 12 | 0 | 0 | 2 | 4 | 0 | 3 |
12 | 13 | 0 | 0 | 2 | 5 | 0 | 3 |
13 | 14 | 0 | 0 | 2 | 4 | 2 | 1 |
14 | 15 | 0 | 0 | 1 | 6 | 2 | 1 |
15 | 16 | 0 | 0 | 1 | 5 | 3 | 0 |
16 | 17 | 1 | 0 | 1 | 6 | 2 | 1 |
17 | 18 | 0 | 0 | 1 | 6 | 0 | 2 |
18 | 19 | 0 | 0 | 1 | 6 | 1 | 1 |
19 | 20 | 0 | 1 | 1 | 7 | 2 | 0 |
20 | 21 | 0 | 1 | 0 | 7 | 0 | 2 |
21 | 22 | 0 | 2 | 1 | 6 | 0 | 2 |
22 | 23 | 0 | 0 | 0 | 9 | 1 | 0 |
23 | 24 | 0 | 0 | 0 | 12 | 1 | 0 |
24 | 25 | 0 | 0 | 0 | 8 | 1 | 1 |
25 | 26 | 0 | 1 | 0 | 8 | 1 | 1 |
26 | 27 | 0 | 0 | 0 | 7 | 0 | 2 |
27 | 28 | 0 | 0 | 0 | 8 | 0 | 1 |
28 | 29 | 0 | 1 | 0 | 8 | 1 | 0 |
29 | 30 | 0 | 1 | 0 | 7 | 1 | 0 |
30 | 31 | 0 | 0 | 0 | 8 | 0 | 1 |
fig, ax = plt.subplots(figsize=(8, 4))

x = bond_counts_df["Frame"]

for i, name in enumerate(bond_names):
    y = bond_counts_df[name]
    ax.plot(x, y, label=name)

ax.set_xlabel("Frame")
ax.set_ylabel("Bond Count")
ax.legend(loc="best", fontsize=8)
fig.tight_layout()
ax;
See also
Python Script
#!/usr/bin/env python
# coding: utf-8

# ## Molecule and Bond Counts from Reactive MD
#
# This example performs molecule and bond counting from a reactive MD trajectory. It first runs a short ReaxFF simulation, then plots molecule populations versus time and bond counts per frame from the generated `ams.rkf`.

# The MD run requires a ReaxFF license. If you already have a reactive MD trajectory with molecule data, you can skip the MD cell and set `ams_rkf_path` to your own file.
#

# ### Initial Imports

from collections import Counter
from pathlib import Path
from typing import Dict, List, Literal, Optional, Sequence, Set, Tuple

import matplotlib.pyplot as plt
from matplotlib.axes import Axes
from scm.inputs import AMS, ReaxFF
from scm.plams import AMSJob, Trajectory, from_smiles, packmol, view, Settings
from scm.plams.tools.plot import plot_molecule_counts


# ### Run a short reactive MD simulation
#
# This produces an `ams.rkf` trajectory with molecule and bond information for analysis.
#

o2 = from_smiles("O=O")
h2 = from_smiles("[HH]")
mixture = packmol(molecules=[o2, h2], n_molecules=[4, 4], density=1.0)
view(mixture, direction="tilt_z", width=300, height=300)

md_settings = Settings()
md_settings.input = AMS(Task="MolecularDynamics")
md_settings.input.Engine = ReaxFF(ForceField="CHO.ff")
md_settings.input.MolecularDynamics.NSteps = 3000
md_settings.input.MolecularDynamics.TimeStep = 0.5
md_settings.input.MolecularDynamics.InitialVelocities.Temperature = 3500
md_settings.input.MolecularDynamics.Trajectory.WriteMolecules = True
md_settings.input.MolecularDynamics.Trajectory.WriteBonds = True
md_settings.runscript.nproc = 1
md_settings.runscript.preamble_lines = ["export OMP_NUM_THREADS=1"]

md_job = AMSJob(name="reactive_md_toy", settings=md_settings, molecule=mixture)
md_results = md_job.run();


# ### Molecule populations versus time
#
# `plot_molecule_counts` reads the molecule analysis from `ams.rkf` and plots the population of every detected molecular formula against time. Pass `species=["H2", "O2"]` to plot only selected formulas, or set `x_axis="frame"` to use trajectory frames instead.
#

ax = plot_molecule_counts(md_job, time_unit="ps")
ax.figure.tight_layout()
ax;
ax.figure.savefig("picture1.png")


# ### Extract the molecule populations
#
# `get_molecule_count_history` returns frame indices, MD times in fs, and a dictionary containing one array per requested formula. Here they are converted to a table for further analysis or export.
#

import pandas as pd

frames, time_fs, molecule_population_history = md_job.results.get_molecule_count_history(
    species=["H2", "O2", "H2O"]
)
molecule_populations = pd.DataFrame({"frame": frames, "time_fs": time_fs, **molecule_population_history})
molecule_populations


# To focus on selected species, pass their molecular formulas with the `species` argument.
#

ax = plot_molecule_counts(md_job, species=["H2", "O2", "H2O"], time_unit="ps")
ax.figure.tight_layout()
ax;
ax.figure.savefig("picture2.png")


# ## Bond counts per frame
#
# Count bond types per frame, using bond order rounded to either integer or half-integer values.
#

import pandas as pd

trajectory = Trajectory(md_job.results.rkfpath())
n_frames = len(trajectory)


def bo_to_symbol(bo):
    s = "---"
    if bo == 0.5:
        s = "--"
    if bo == 1.0:
        s = "-"
    if bo == 1.5:
        s = "=="
    if bo == 2.0:
        s = "="
    if bo == 2.5:
        s = "≡≡"
    if bo == 3.0:
        s = "≡"
    return s


all_bonds = {}
for frame_index, mol in enumerate(trajectory):
    frame_counts: Counter = Counter()
    seen_pairs: Set[Tuple[int, int]] = set()

    for bond in mol.bonds:
        pair = tuple(sorted((mol.index(bond.atom1), mol.index(bond.atom2))))
        if pair in seen_pairs:
            continue
        seen_pairs.add(pair)

        symbols = sorted((bond.atom1.symbol, bond.atom2.symbol))
        bo = float(round(bond.order))
        label = f"{symbols[0]}{bo_to_symbol(bo)}{symbols[1]} (BO {bo:.1f})"
        frame_counts[label] += 1

    for label, count in frame_counts.items():
        if label not in all_bonds:
            all_bonds[label] = [0] * n_frames
        all_bonds[label][frame_index] = int(count)

bond_names = sorted(all_bonds.keys())
bond_counts = []
for frame_index in range(n_frames):
    counts = {"Frame": frame_index + 1}
    for name in bond_names:
        counts[name] = all_bonds[name][frame_index]
    bond_counts.append(counts)

bond_counts_df = pd.DataFrame(bond_counts)
print(bond_counts_df)


fig, ax = plt.subplots(figsize=(8, 4))

x = bond_counts_df["Frame"]

for i, name in enumerate(bond_names):
    y = bond_counts_df[name]
    ax.plot(x, y, label=name)

ax.set_xlabel("Frame")
ax.set_ylabel("Bond Count")
ax.legend(loc="best", fontsize=8)
fig.tight_layout()
ax;
ax.figure.savefig("picture3.png")