
Basic MD Trajectory Analysis with PLAMS
This example shows how to calculate several standard trajectory-analysis quantities from molecular dynamics:
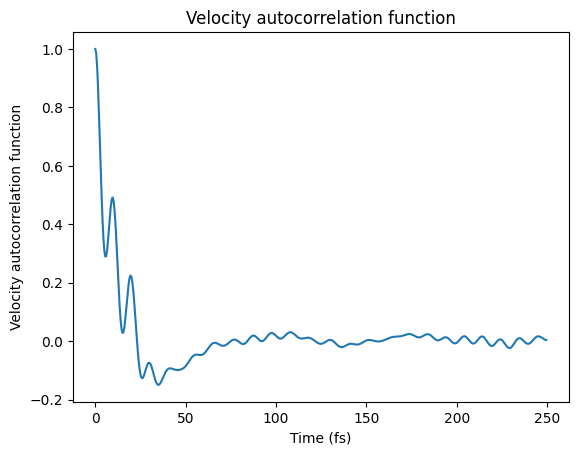
the velocity autocorrelation function (VACF)
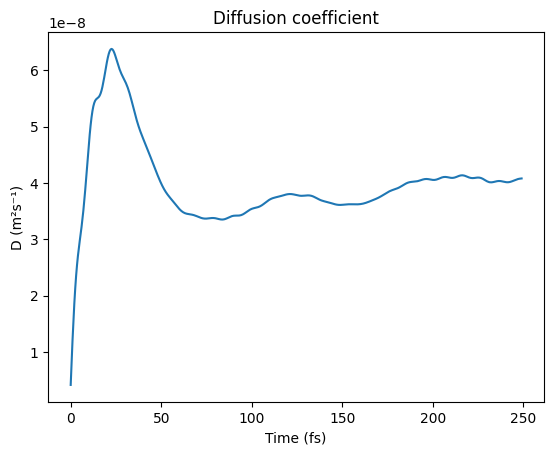
the diffusion coefficient from the integral of the VACF
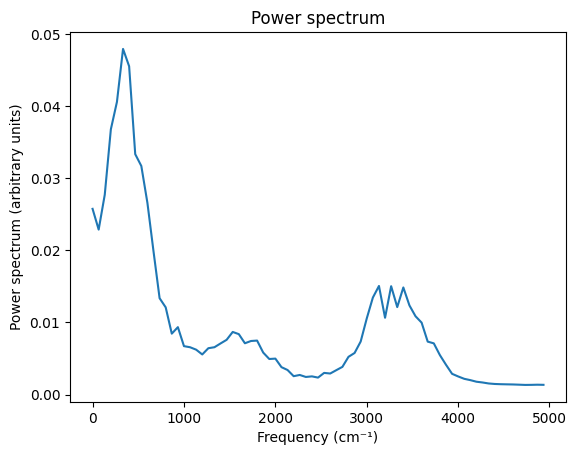
the power spectrum from the Fourier transform of the VACF
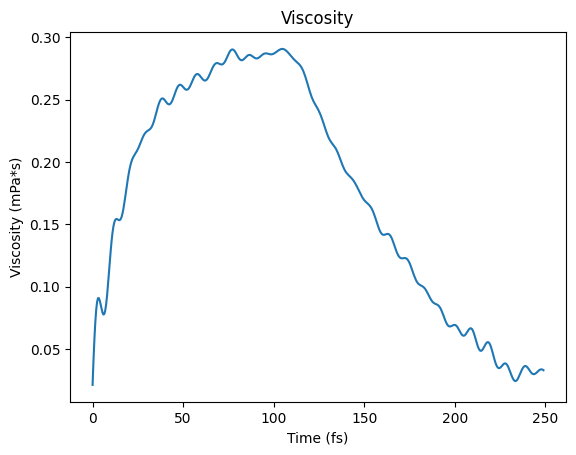
the viscosity from the Green-Kubo relation using the off-diagonal pressure-tensor autocorrelation function
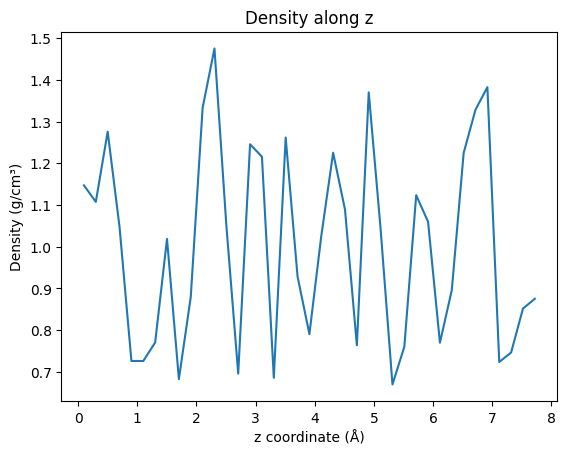
the density profile along the z axis
The example focuses on the mechanics of extracting these quantities. For production simulations, the trajectories must be much longer and the analysis must be checked for convergence. For a broader molecular-dynamics workflow example, see also Molecular Dynamics with Python.
Initial Imports
import os
import numpy as np
import matplotlib.pyplot as plt
from scm.base import ChemicalSystem
from scm.inputs import AMS, ReaxFF
from scm.plams import packmol, Settings, AMSJob, view
Run Simple MD Simulation of Water
Run a short MD simulation of 16 water molecules in a box.
mol = packmol(ChemicalSystem.from_smiles("O"), n_molecules=16, density=1.0)
s = Settings()
s.input = AMS(Task="MolecularDynamics")
s.input.Engine = ReaxFF(ForceField="Water2017.ff")
s.input.MolecularDynamics.CalcPressure = True
s.input.MolecularDynamics.InitialVelocities.Temperature = 300
s.input.MolecularDynamics.Trajectory.SamplingFreq = 1
s.input.MolecularDynamics.TimeStep = 0.5
s.input.MolecularDynamics.NSteps = 2000
s.runscript.nproc = 1
os.environ["OMP_NUM_THREADS"] = "1"
job = AMSJob(settings=s, molecule=mol, name="md")
job.run();
[19.10|12:12:32] JOB md STARTED
[19.10|12:12:32] JOB md RUNNING
[19.10|12:12:37] JOB md FINISHED
[19.10|12:12:38] JOB md SUCCESSFUL
view(mol, direction="tilt_z", width=300, height=300, padding=-1)

Or alternatively, load a previously run MD job:
# job = AMSJob.load_external('/path/to/ams.rkf')
results = job.results
Velocity Autocorrelation Function
times, vacf = results.get_velocity_acf(start_fs=0, max_dt_fs=250, normalize=False)
normalized_vacf = vacf / vacf[0]

A = np.stack((times, normalized_vacf), axis=1)
np.savetxt("plams_vacf.txt", A, header="Time(fs) VACF")

fig, ax = plt.subplots()
ax.plot(times, normalized_vacf)
ax.set_xlabel("Time (fs)")
ax.set_ylabel("Velocity autocorrelation function")
ax.set_title("Velocity autocorrelation function")
ax;
Diffusion Coefficient
t_D, D = results.get_diffusion_coefficient_from_velocity_acf(times, vacf)

A = np.stack((t_D, D), axis=1)
np.savetxt("plams_vacf_D.txt", A, header="time(fs) D(m^2*s^-1)")

fig, ax = plt.subplots()
ax.plot(t_D, D)
ax.set_xlabel("Time (fs)")
ax.set_ylabel("D (m²s⁻¹)")
ax.set_title("Diffusion coefficient")
ax;
Power Spectrum
freq, intensities = results.get_power_spectrum(times, vacf, number_of_points=1000)

A = np.stack((freq, intensities), axis=1)
np.savetxt("plams_power_spectrum.txt", A, header="Frequency(cm^-1) PowerSpectrum")

fig, ax = plt.subplots()

ax.plot(freq, intensities)
ax.set_xlabel("Frequency (cm⁻¹)")
ax.set_ylabel("Power spectrum (arbitrary units)")
ax.set_title("Power spectrum")
ax;
Green-Kubo Viscosity
t, viscosity = results.get_green_kubo_viscosity(
    start_fs=0, max_dt_fs=250
)  # do not do this for NPT simulations

A = np.stack((t, viscosity), axis=1)
np.savetxt("plams_green_kubo_viscosity.txt", A, header="Time(fs) Viscosity(mPa*s)")

fig, ax = plt.subplots()

ax.plot(t, viscosity)
ax.set_xlabel("Time (fs)")
ax.set_ylabel("Viscosity (mPa*s)")
ax.set_title("Viscosity")
ax;
Density Along Axis
z, density = results.get_density_along_axis(
    axis="z", density_type="mass", bin_width=0.2, atom_indices=None
)

A = np.stack((z, density), axis=1)
np.savetxt("plams_density_along_z.txt", A, header="z(angstrom) density(g/cm^3)")

fig, ax = plt.subplots()

ax.plot(z, density)
ax.set_xlabel("z coordinate (Å)")
ax.set_ylabel("Density (g/cm³)")
ax.set_title("Density along z")
ax;
See also
Python Script
#!/usr/bin/env python
# coding: utf-8

# ## Initial Imports

import os
import numpy as np
import matplotlib.pyplot as plt
from scm.base import ChemicalSystem
from scm.inputs import AMS, ReaxFF
from scm.plams import packmol, Settings, AMSJob, view


# ## Run Simple MD Simulation of Water

# Run a short MD simulation of 16 water molecules in a box.

mol = packmol(ChemicalSystem.from_smiles("O"), n_molecules=16, density=1.0)
s = Settings()
s.input = AMS(Task="MolecularDynamics")
s.input.Engine = ReaxFF(ForceField="Water2017.ff")
s.input.MolecularDynamics.CalcPressure = True
s.input.MolecularDynamics.InitialVelocities.Temperature = 300
s.input.MolecularDynamics.Trajectory.SamplingFreq = 1
s.input.MolecularDynamics.TimeStep = 0.5
s.input.MolecularDynamics.NSteps = 2000
s.runscript.nproc = 1
os.environ["OMP_NUM_THREADS"] = "1"
job = AMSJob(settings=s, molecule=mol, name="md")
job.run();


view(mol, direction="tilt_z", width=300, height=300, padding=-1, picture_path="picture1.png")


# Or alternatively, load a previously run MD job:

# job = AMSJob.load_external('/path/to/ams.rkf')
results = job.results


# ## Velocity Autocorrelation Function

times, vacf = results.get_velocity_acf(start_fs=0, max_dt_fs=250, normalize=False)
normalized_vacf = vacf / vacf[0]

A = np.stack((times, normalized_vacf), axis=1)
np.savetxt("plams_vacf.txt", A, header="Time(fs) VACF")

fig, ax = plt.subplots()
ax.plot(times, normalized_vacf)
ax.set_xlabel("Time (fs)")
ax.set_ylabel("Velocity autocorrelation function")
ax.set_title("Velocity autocorrelation function")
ax;
ax.figure.savefig("picture2.png")


# ## Diffusion Coefficient

t_D, D = results.get_diffusion_coefficient_from_velocity_acf(times, vacf)

A = np.stack((t_D, D), axis=1)
np.savetxt("plams_vacf_D.txt", A, header="time(fs) D(m^2*s^-1)")

fig, ax = plt.subplots()
ax.plot(t_D, D)
ax.set_xlabel("Time (fs)")
ax.set_ylabel("D (m²s⁻¹)")
ax.set_title("Diffusion coefficient")
ax;
ax.figure.savefig("picture3.png")


# ## Power Spectrum

freq, intensities = results.get_power_spectrum(times, vacf, number_of_points=1000)

A = np.stack((freq, intensities), axis=1)
np.savetxt("plams_power_spectrum.txt", A, header="Frequency(cm^-1) PowerSpectrum")

fig, ax = plt.subplots()

ax.plot(freq, intensities)
ax.set_xlabel("Frequency (cm⁻¹)")
ax.set_ylabel("Power spectrum (arbitrary units)")
ax.set_title("Power spectrum")
ax;
ax.figure.savefig("picture4.png")


# ## Green-Kubo Viscosity

t, viscosity = results.get_green_kubo_viscosity(
    start_fs=0, max_dt_fs=250
)  # do not do this for NPT simulations

A = np.stack((t, viscosity), axis=1)
np.savetxt("plams_green_kubo_viscosity.txt", A, header="Time(fs) Viscosity(mPa*s)")

fig, ax = plt.subplots()

ax.plot(t, viscosity)
ax.set_xlabel("Time (fs)")
ax.set_ylabel("Viscosity (mPa*s)")
ax.set_title("Viscosity")
ax;
ax.figure.savefig("picture5.png")


# ## Density Along Axis

z, density = results.get_density_along_axis(
    axis="z", density_type="mass", bin_width=0.2, atom_indices=None
)

A = np.stack((z, density), axis=1)
np.savetxt("plams_density_along_z.txt", A, header="z(angstrom) density(g/cm^3)")

fig, ax = plt.subplots()

ax.plot(z, density)
ax.set_xlabel("z coordinate (Å)")
ax.set_ylabel("Density (g/cm³)")
ax.set_title("Density along z")
ax;
ax.figure.savefig("picture6.png")