Vibrational circular dichroism (VCD)
This tutorial will teach you how to calculate and analyze the vibrational circular dichroism (VCD) spectrum of a small molecule using ADF and VCDtools.
Create your oxirane molecule
These are the coordinates of the oxirane molecule:
C      -1.44589917      -0.26968372      -0.00000000
C       0.02774960      -0.35459913      -0.00000000
O      -0.64012001       0.88449058      -0.00000000
H      -1.94641916      -0.41741698       0.97962259
H      -1.94641916      -0.41741698      -0.97962259
H       0.50817848      -0.55867470      -0.97957478
H       0.50817848      -0.55867469       0.97957478
Copy-paste these into AMSinput:
Now you should have the oxirane molecule.
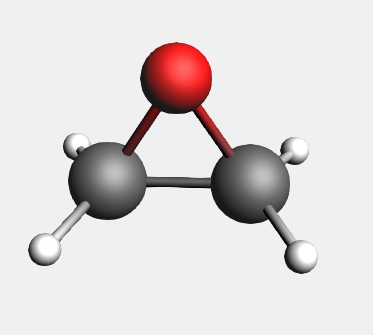
To ensure chirality, two hydrogen atoms should be changed to deuterium atoms:
The panel area changes to display the atom details menu.
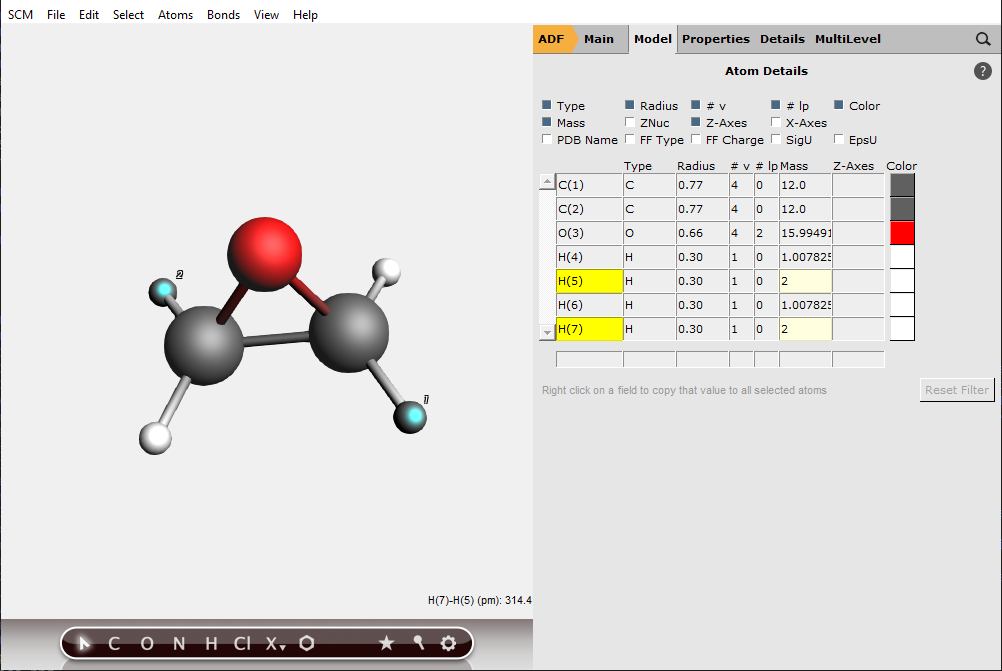
Note that if the two other hydrogen atoms are changed to deuterium atoms then one has the mirror image of this molecule, and one would get an inverse VCD spectrum.
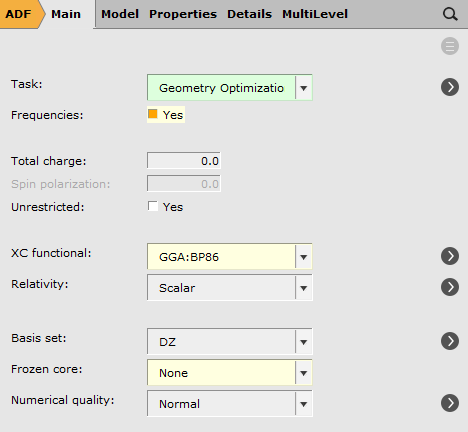
Set up and run the calculation
We will perform a geometry optimization followed by frequency + VCD
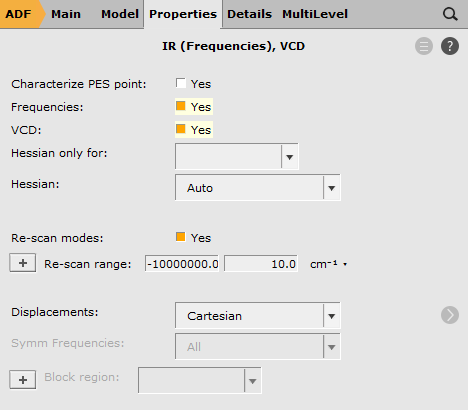
To request the calculation of VCD intensities:
Now run ADF:
Now ADF will start automatically, and you can follow the calculation in the logfile.
Analyze the VCD Spectra
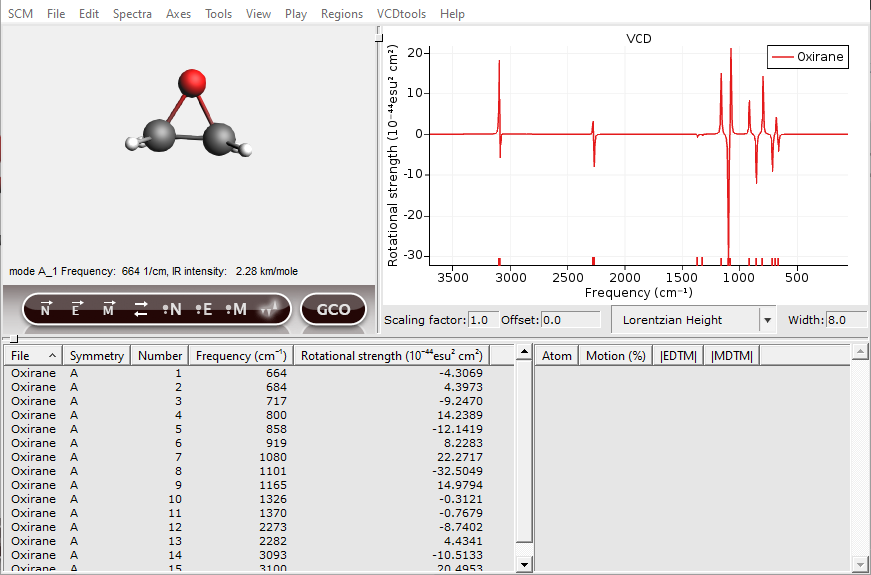
Next start analyzing the VCD spectrum with AMSspectra. To open the spectra:
Basically, two types of analysis methods are offered by the analysis program VCDtools. First, it can visualize the properties relevant for the VCD intensity, i.e., the Electric and Magnetic Dipole Transition Moments (EDTM and MDTM) and the normal mode motion. Second, a General Coupled Oscillator (GCO) analysis can be performed.
Normal modes can be selected either by clicking in the spectrum or by clicking in the ‘Vibrations Window’. After a normal mode is selected the vibration will be shown in the molecule and some details will be given in the right side of the ‘Vibrations Window’. In the next picture ‘1/cm’ is chosen as horizontal unit, with a ‘Lorentzian Height’ line shape and a width of ‘8.0’.
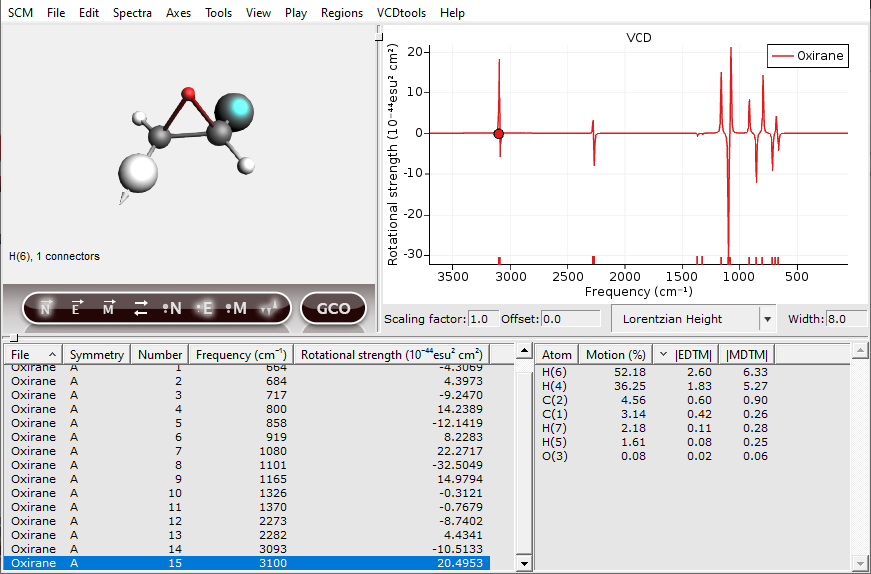
Now one of the hydrogens should be selected. In general, atoms with a high contribution to the EDTM are important for the VCD intensity. To show this a GCO analysis will be performed in the following.
The atom sizes are now scaled by their EDTM and the nuclear displacement vectors are shown as arrows. To scale the size of these arrows, use the “up” and “down” keys. Using these visualization settings, we immediately see that two of the C-H groups are important for the VCD signal in this normal mode. You can change which vectors are visualized, the phase of these vectors and the scaling of the atoms by clicking the buttons underneath the molecule. The buttons that are active will have a glow effect.
The next step in a GCO analysis is to select VCD active fragments:
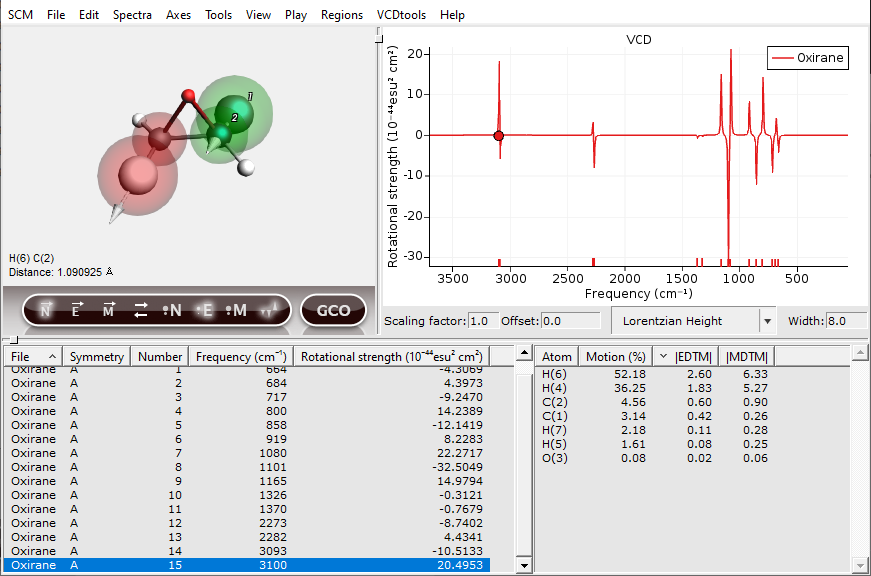
The two important regions will be highlighted by transparent red and green spheres. Additional tools for setting up the regions can be found under the “Regions” menu.
The current regions will have been saved in the ‘.results/adf.results’ folder in the file ‘Regions.txt’ and can be loaded by the command: Regions → Load Regions → ‘Name’.
To determine whether the coupling between two important C-H groups is important to the rotational strength it can be decomposed using the GCO formalism.
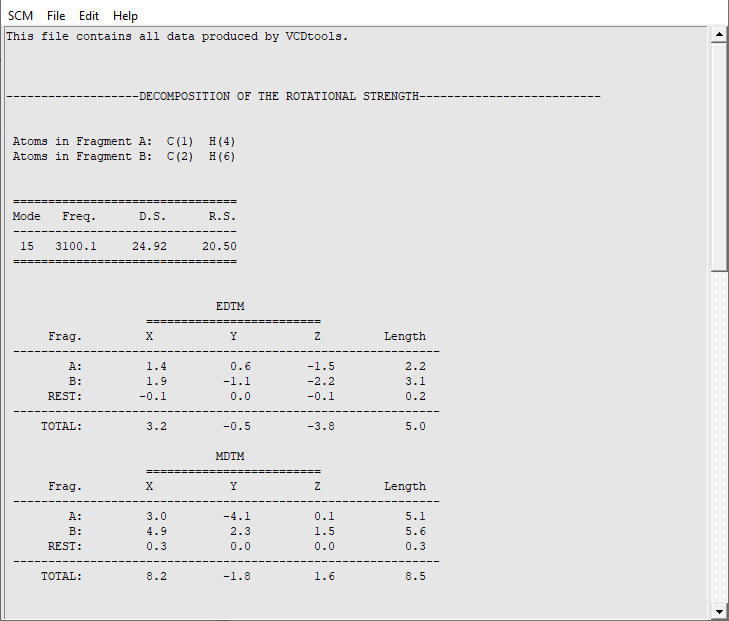
An ‘AMStail’ window will now have opened showing the ‘vcdtools.txt’ file. In this file all output from VCDtools is stored. Each output entry begins by defining the settings such as the selected regions and normal modes. For normal mode 15 we see that indeed the major part of the VCD signal is caused by the GCO interaction between the two selected regions. The rest of the molecule barely contributes and also the VCD signal from the individual fragments is insignificant. We have thus successfully determined the source of the VCD intensity for normal mode 15.
If needed arrows can be shown inside the molecule to indicate the EDTM and the MDTM. This can be done per atom or per regions. For example:
Two arrows will have appeared at the geometric centers of the regions displaying the relative size and direction of the EDTMs.
Under the “VCDtools” menu there are many other commands. For example, VCDtools can guess the best fragments for GCO fragments and can compute the normal mode localization on the selected regions within the molecule. Feel free to test them out.