Vibrational frequencies and IR spectrum of ethane
Create an ethane molecule
Next we create an ethane molecule:
 )
)

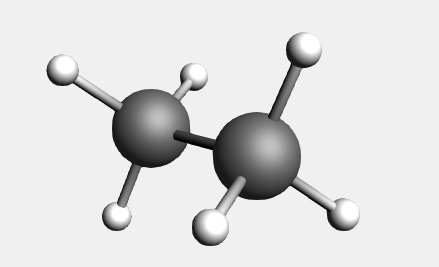
You need to add hydrogen twice: the first time one carbon atom was selected. Thus, the ‘Add Hydrogen’ command added the hydrogen to that selected atom only. By repeating the ‘Add Hydrogen’ command the hydrogens are added in all possible places.
The symmetrization should have enforced perfect D(3D) symmetry, using the Symmol program (see the help balloon on that button for details).
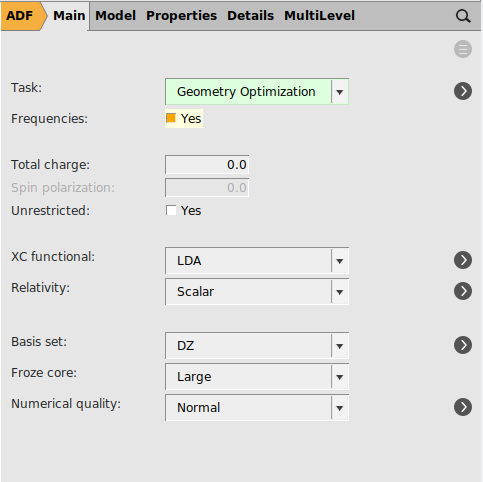
Geometry optimization and vibrational frequencies calculation
We will now set up a geometry optimization followed by a frequency calculation:
Now run the calculation:
Visualize the IR-spectrum, normal modes
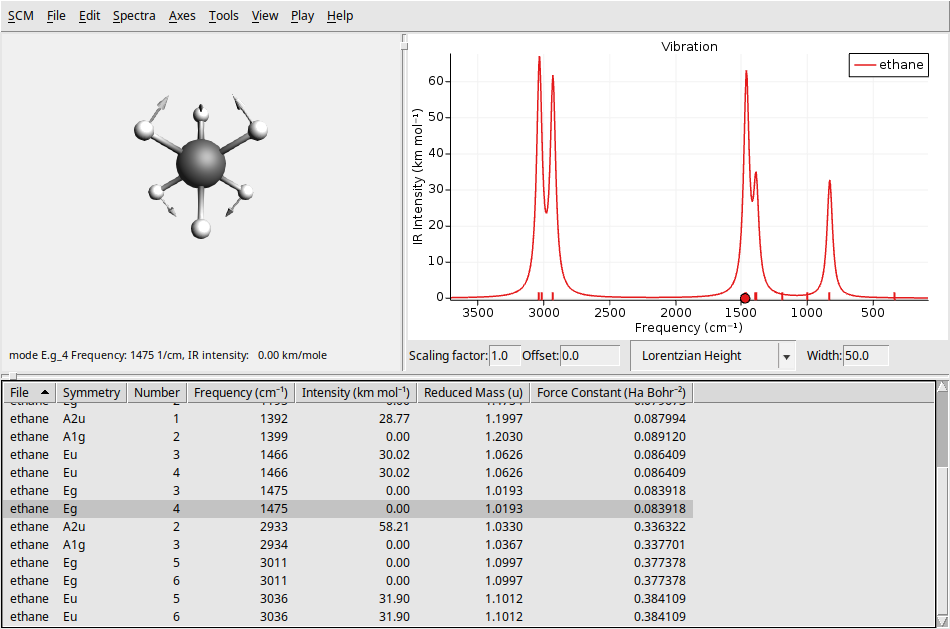
The IR spectrum can be visualized using the AMSspectra module.
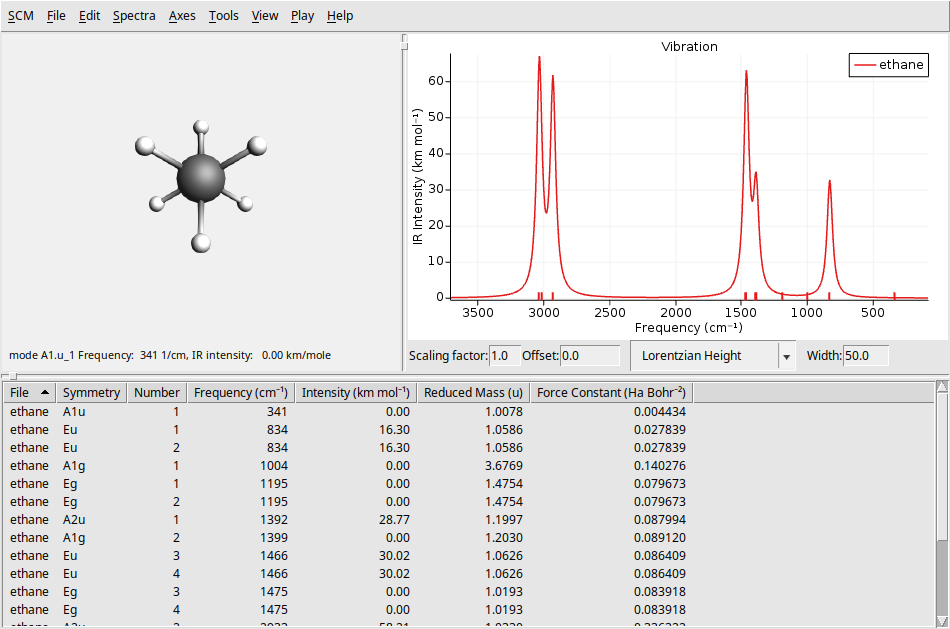
On the left side of the window the molecule (Ethane) is shown.
On the right side the IR spectrum is shown.
Tip
save a picture (of the IR spectrum) as an image: File → Save Image… (PNG by default)
export the xy coordinates of the spectrum to a plain text file: File → Export XY Values….
export the peak positions and intensities to a plain text file: File → Export XY Peaks….
Increase the spectral linewidth (Width box beneath spectrum) to obtain a spectrum that looks better.
Below the spectrum window a table is shown with details about the peaks.
You can click on a peak in the spectrum, or select a line in the table:
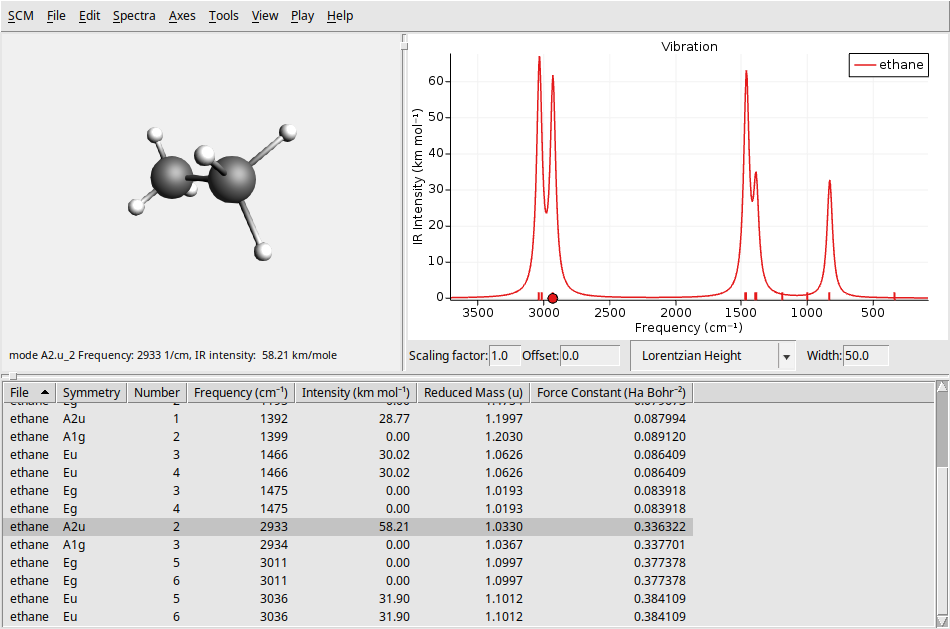
The atoms of the molecule should be animated according to the selected normal mode (see also the options in the Play menu in the menu bar).
To view another normal mode, you can use the left and right arrow keys to move through them.
You can make the displacements larger or smaller via menu commands, or via the up and down arrow keys on the keyboard (after clicking in the graph or molecule window).
To show the normal mode as vectors:
You can make the vectors larger or smaller using the same ctrl/cmd-L/K, or arrow up and down.
You can also visualize the normal mode in AMSmovie (which offers some extra options, e.g. you can make an mpg movie showing the mode)
In AMSmovie you have some extra advanced options, for example you can make an mpg movie showing the mode.
See also
You can close all open AMS-GUI windows by selecting in the menu bar SCM → Quit All,