UV/Vis spectrum of Ir(ppy)3
In this tutorial we will use time-dependent DFTB to calculate the UV/Vis absorption spectrum of the Iridium complex Ir(ppy)3.
Ir    0.012398    0.011138   -0.034888
N    -0.039454    0.033020    2.182572
C     1.196760   -0.025409    2.759734
C     1.312058    0.049492    4.160403
H     2.297136    0.010793    4.623158
C     0.176907    0.180049    4.949521
H     0.267945    0.241793    6.035562
C    -1.080728    0.227837    4.337521
H    -1.998559    0.321169    4.918229
C    -1.136029    0.147902    2.951293
H    -2.086922    0.175812    2.417126
C     2.320171   -0.152466    1.829294
C     2.023265   -0.155989    0.436568
C     3.102011   -0.288673   -0.454369
H     2.909074   -0.300226   -1.528367
C     4.415258   -0.411210    0.002305
C     4.695599   -0.406624    1.375984
H     5.722404   -0.504771    1.732389
C     3.649435   -0.277487    2.282572
H     3.871783   -0.280893    3.351436
H     5.231463   -0.511562   -0.717544
C     0.348035    0.181591   -2.073796
C     0.477555    1.514919   -2.556751
C     0.724684    1.764358   -3.922454
H     0.829885    2.787826   -4.287727
C     0.844594    0.712499   -4.823508
H     1.037805    0.912270   -5.878913
C     0.719659   -0.604432   -4.359020
H     0.813485   -1.438052   -5.059452
C     0.474019   -0.859703   -3.009006
H     0.385255   -1.893716   -2.671738
C     0.365837    2.600714   -1.582092
N     0.167789    2.211524   -0.287922
C     0.070484    3.136313    0.682683
H    -0.072051    2.747901    1.692346
C     0.145763    4.501897    0.436809
C     0.336880    4.923011   -0.884173
H     0.401581    5.985888   -1.124354
C     0.445887    3.971689   -1.889620
H     0.597414    4.283773   -2.922014
H     0.063205    5.212485    1.259290
N    -2.184281   -0.109350   -0.312568
C    -2.661123   -1.388612   -0.350406
C    -4.046619   -1.609170   -0.458307
H    -4.429551   -2.628420   -0.482142
C    -4.923390   -0.534729   -0.529917
H    -5.997987   -0.707636   -0.612774
C    -4.412321    0.767839   -0.500666
H    -5.061792    1.641013   -0.565173
C    -3.036095    0.927439   -0.392594
H    -2.577985    1.917423   -0.370095
C    -1.646438   -2.441110   -0.271132
C    -0.290616   -2.036409   -0.112573
C     0.684523   -3.046718   -0.059045
H     1.733837   -2.770376    0.056220
C     0.343229   -4.396378   -0.157833
C    -0.995273   -4.783541   -0.314549
H    -1.261180   -5.838892   -0.394860
C    -1.983096   -3.806784   -0.368630
H    -3.023159   -4.112311   -0.498560
H     1.126462   -5.157297   -0.113713
 →
→  .
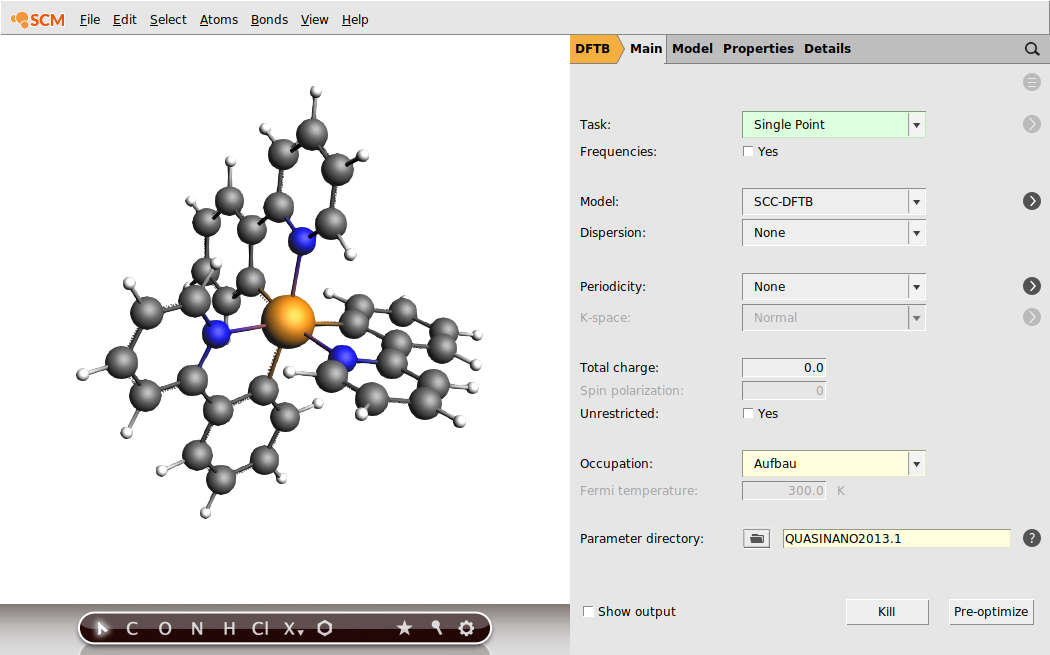
.TD-DFTB is based on the SCC extension to DFTB and is therefore best used with the SCC-DFTB model. It is also incompatible with fractional occupation numbers, so we switch to the Aufbau occupation scheme.
We need to select a parameter set that includes Iridium.
Your AMSinput window should look like this:
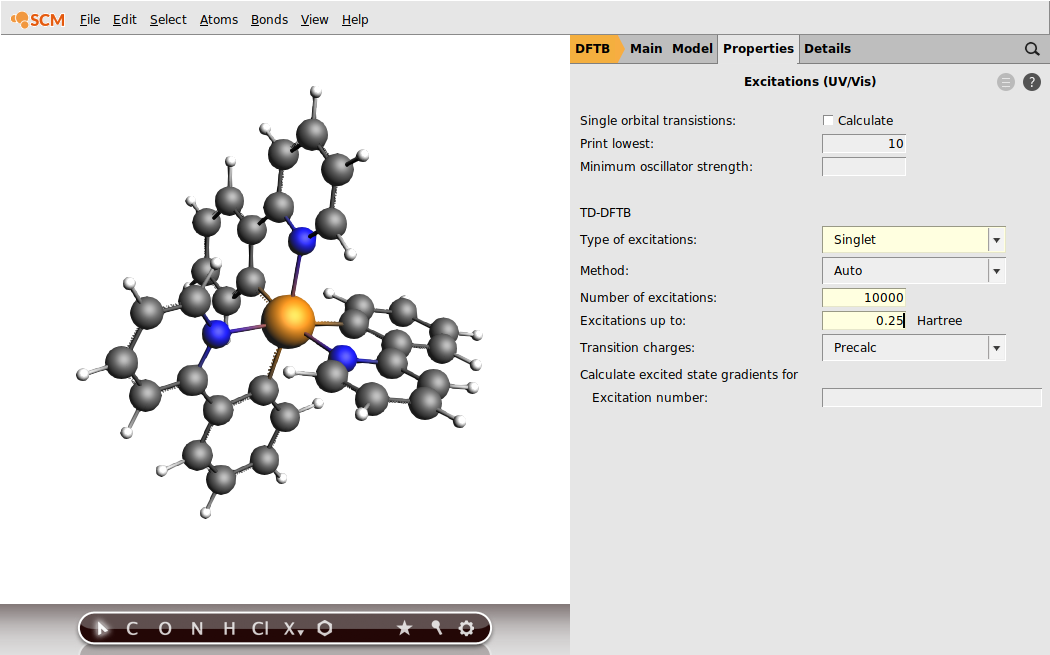
We want to obtain the absorption spectrum up to 6 eV, so we allow for some safety margin and calculate all singlet-singlet excitations up to 6.8 eV which is 0.25 Hartree. The “Number of excitations” field acts an upper limit for the calculated number of excitations if the “Excitations up to” field is used. We do not need an upper limit for this tutorial, so we set it to something large.
We are now ready to run the calculation. It should only take a few seconds.
We can now use AMSspectra to have a look at absorption spectrum.
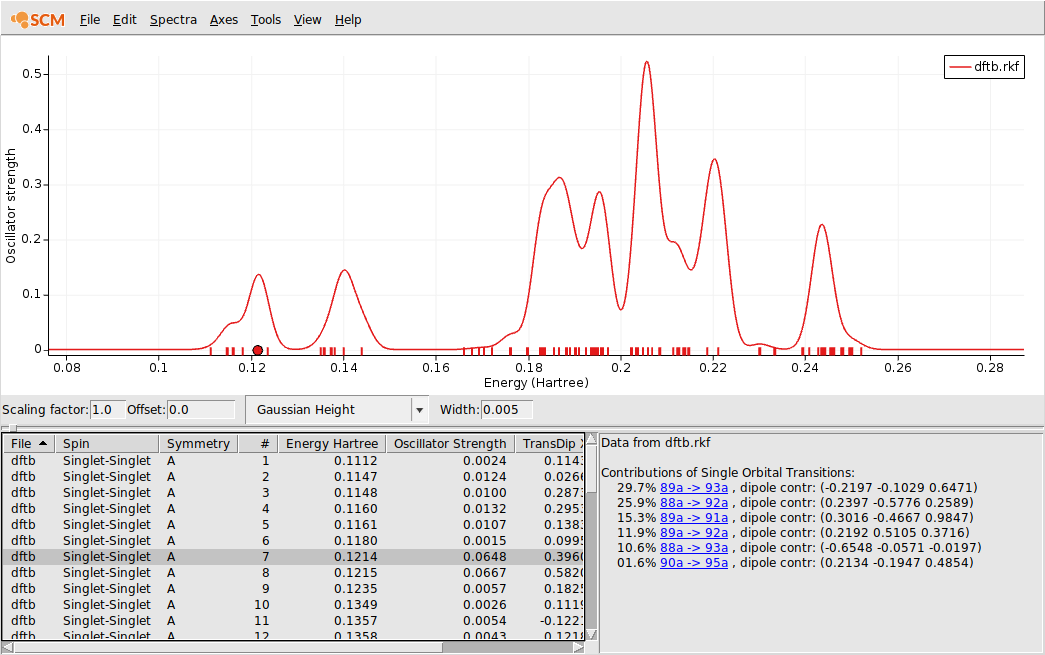
Note
The energy unit may be shown in eV instead.
You can modify the broadening width by changing Width.