Distribution of species in multispecies calculations
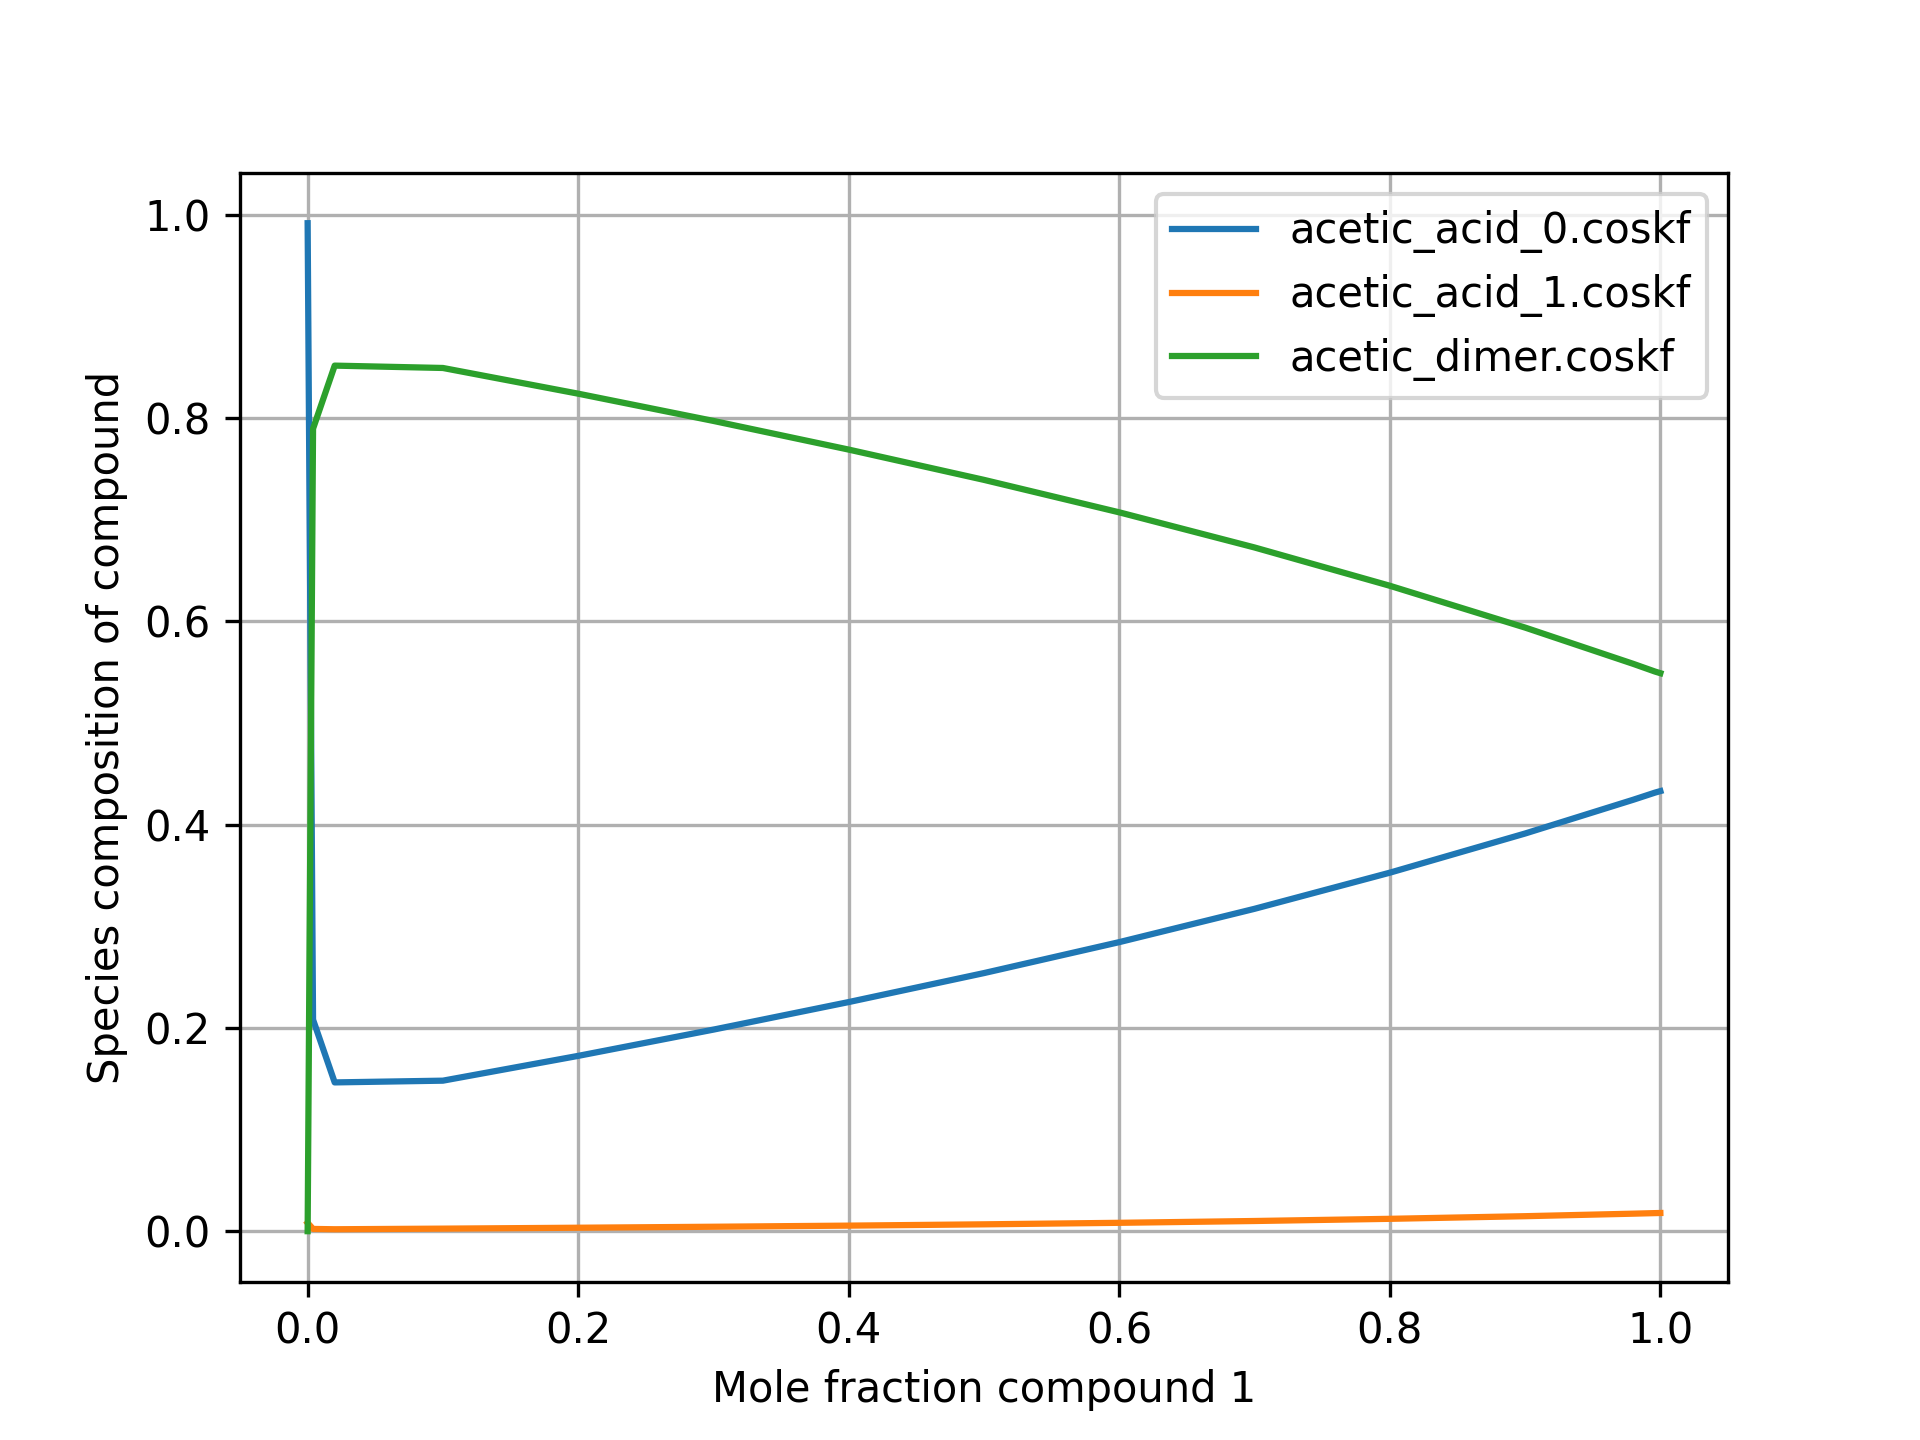
COSMO-RS can be used with compounds which can be composed of multiple possible species . For these types of calculations, it is often desirable to know the distribution of the various possible forms/species that constitute a certain compound. In the following script, a binary mixture calculation is performed using benzene and an acetic acid compound which is capable of existing as either of 2 conformers or as a dimer. The distribution of these species is plotted as a function of mole fraction.
Python code (Binary mixture)
[show/hide code]
import os
import matplotlib.pyplot as plt
from scm.plams import Settings, init, finish, CRSJob, config

##################  Note: Ensure to download the coskf_acetic_acid before running the script  ##################
database_path = os.path.abspath("./coskf_acetic_acid")

if not os.path.exists(database_path):
    raise OSError(f"The provided path does not exist. Exiting.")


def adjust_name(s):
    return os.path.basename(s)


init()
# suppress plams output
config.log.stdout = 0

# initialize settings object
settings = Settings()
settings.input.property._h = "BINMIXCOEF"
# optionally, change to the COSMOSAC2013 method
# settings.input.method = 'COSMOSAC2013'

# set the number of compounds
num_compounds = 2
compounds = [Settings() for i in range(num_compounds)]

compounds[0].name = "acetic_acid"
form = [Settings() for i in range(3)]

form[0]._h = os.path.join(database_path, "acetic_acid_0.coskf")

form[1]._h = os.path.join(database_path, "acetic_acid_1.coskf")

form[2]._h = os.path.join(database_path, "acetic_dimer.coskf")
form[2].count = 2
form[2].Hcorr = 9.25

compounds[0].form = form

compounds[1]._h = os.path.join(database_path, "Benzene.coskf")
compounds[1].name = "Benzene"

settings.input.temperature = 298.15

# specify the compounds as the compounds to be used in the calculation
settings.input.compound = compounds
# create a job that can be run by COSMO-RS
my_job = CRSJob(settings=settings)
# run the job
out = my_job.run()

# convert all the results into a python dict
res = out.get_results()

compositions = out.get_multispecies_dist()

mf1 = res["molar fraction"][0]

plot_comp = 0  # we'll plot the first compound (acetic acid)
for struct, vals in compositions[plot_comp].items():
    plt.plot(mf1, vals, label=adjust_name(struct))

plt.xlabel("Mole fraction compound 1")
plt.ylabel("Species composition of compound")
plt.legend(loc="upper right")
plt.grid()
# plt.savefig("./ms_distribution.png", dpi=300)
plt.show()

finish()
This code produces the following output: