Vibrational frequencies and IR spectrum of ethane
Step 1: Start ADFinput
For this tutorial we again prefer to work in the Tutorial directory:
- cd $HOMEStart ADFjobsClick on the Tutorial folder iconStart ADFinput using the SCM menu
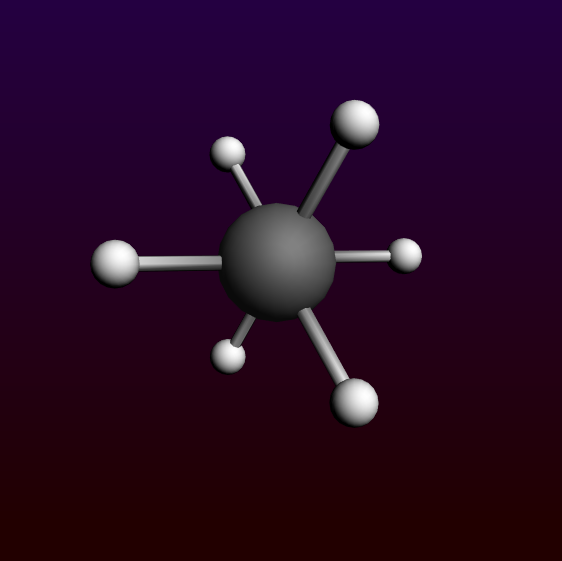
Step 2: Create your ethane molecule
Next we create an ethane molecule. This is almost identical to making ethanol:
- Select the C-toolClick once to make a carbon atomClick again to make a second carbon atomSelect Atoms → Add HydrogensAnd do it again: ... add hydrogensClick the pre-optimize button (the cog wheel)Click the Symmetrize button (the button with the star, on the bottom toolbar)
You need to add hydrogen twice: the first time one carbon atom was selected. Thus, the ‘Add Hydrogen’ command added the hydrogen to that selected atom only. By repeating the ‘Add Hydrogen’ command the hydrogens are added in all possible places.
Alternatively, you can, after placing the second atom, click on that atom to finish using the C-tool. In this case none of the carbon atoms will be selected and you can easily add all the hydrogens at the same time.
The symmetrization should have enforced perfect D3d symmetry, using the Symmol program. The Symmol program has been developed by Pilati and Forni, see the balloon help on that button for details..
Step 3: Optimize the geometry
Now optimize the geometry using ADF, as in the second tutorial:
- Enter a title (like ‘Ethane’)Select the ‘Geometry Optimization’ presetSelect File → RunSave your input with a nice name (‘ethane’)Wait for the calculation to finish (check the logfile)In the dialog that appears, click Yes to import the optimized geometry
Step 4: Calculate the vibrational frequencies of ethane
Now we will set up and run the frequencies calculation. It is important to start with the optimized structure, so make sure you did import the optimized coordinates (the last step of the previous instructions).
- Select the ‘Frequencies’ preset

For the tutorial we will use the default XC potential. For better results you should select a better XC potential.
- Select File → RunClick ‘OK’ to save over the previous versionClick ‘Yes’ when ADFjobs warns that results are already presentWait for the calculation to finish
Step 5: Results of your calculation
Logfile: ADFtail
When the calculation is finished the end of your logfile will look something like this:
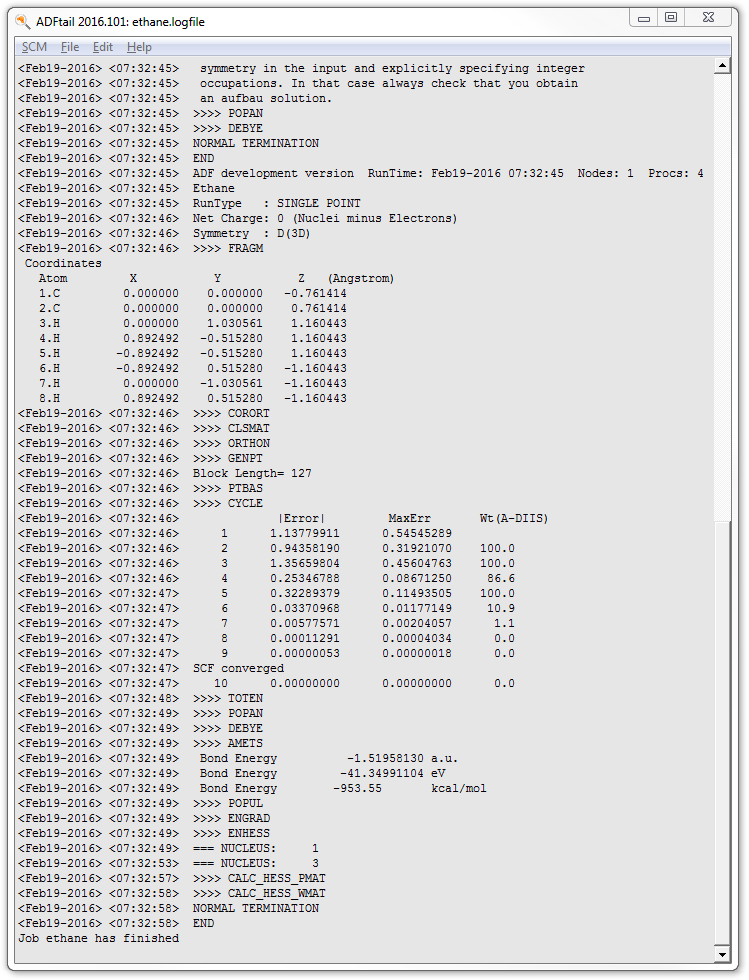
At the end ADF calculates the force constants for the vibrations.
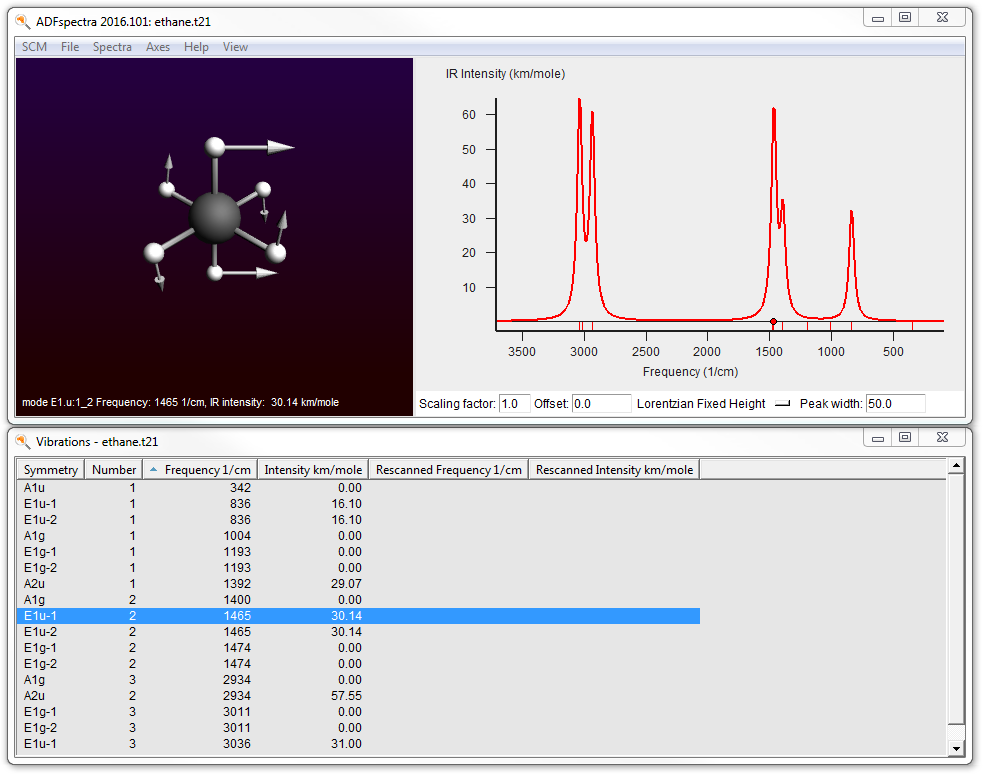
IR-spectrum (vibrational spectrum): ADFspectra with normal mode selector and ADFmovie
- Select SCM → Spectra
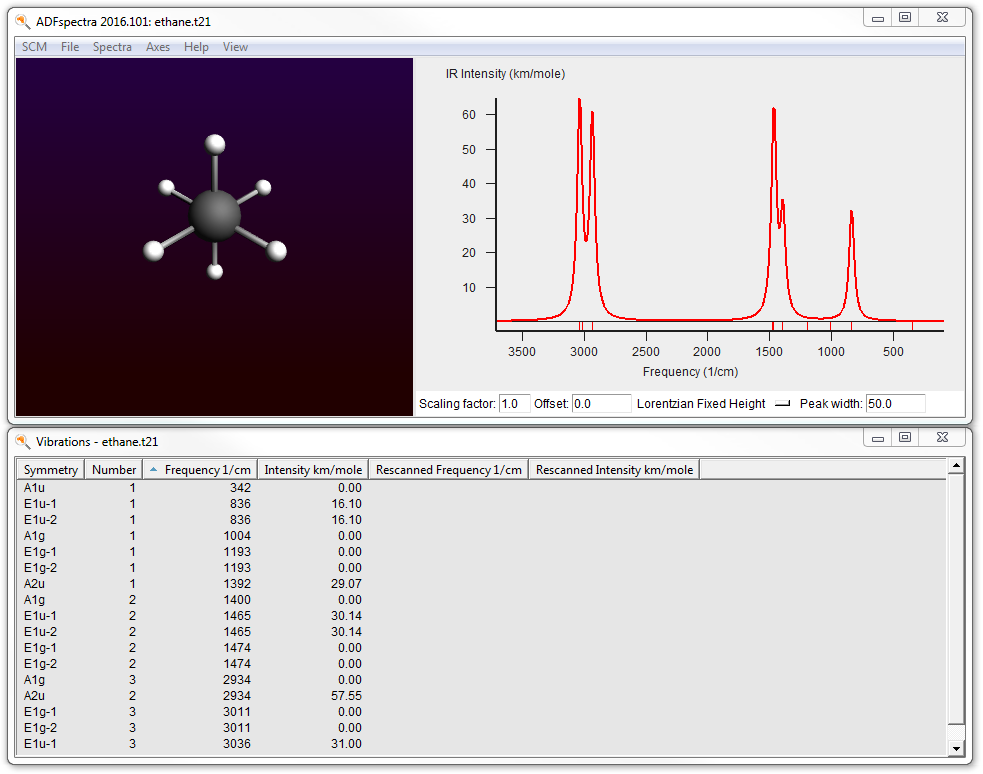
On the left side of the window the molecule (Ethane) is shown.
On the right side the IR spectrum is shown. You can save a picture (of the IR spectrum) to use in other programs using the ‘Save Postscript’ command from the ‘File’ menu. Alternatively, you may export the xy coordinates of the spectrum to a plain text file for you own graphing application.
Below the spectrum window a table is shown with details about the peaks.
You can click on a peak in the spectrum, or select a line in the table:
- Click on the highest peak in the spectrum
The atoms of the molecule should be animated according to the selected normal mode.
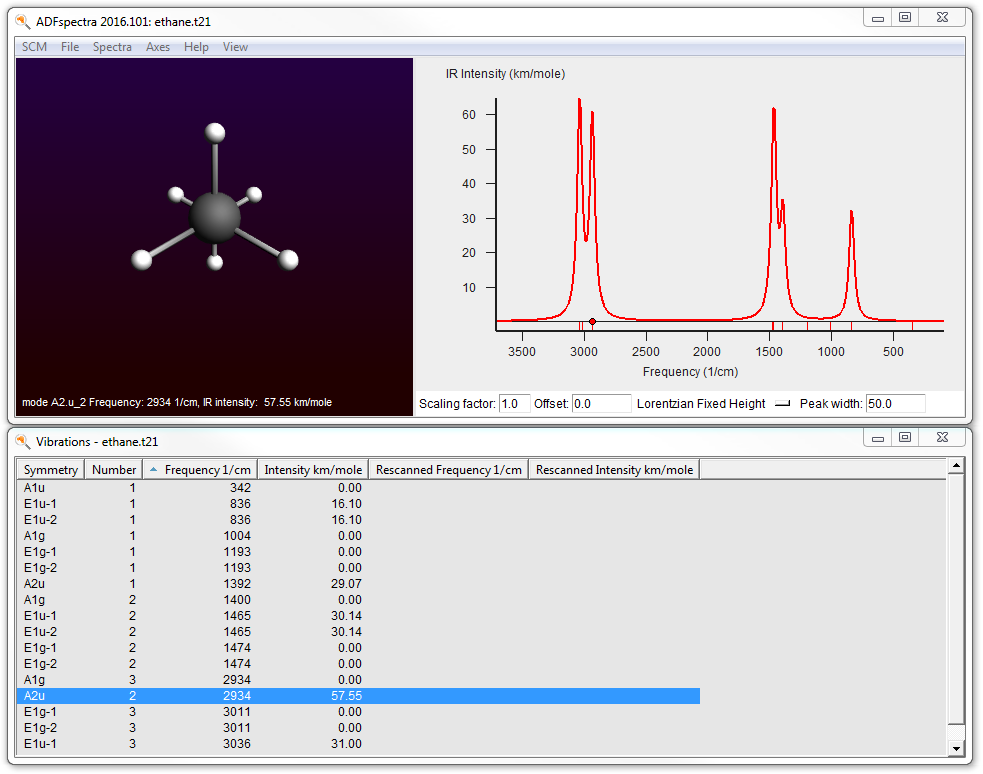
The corresponding normal mode should be shown on the left.
To view another normal mode, most conveniently use the left and right arrow keys to move through them. This only works after clicking in the graph or molecule window. Alternatively, select the mode in the table and use the up/down arrow keys.
You can make the displacements larger or smaller via menu commands. Or, more conveniently, use the up and down arrow keys on the keyboard (after clicking in the graph or molecule window). And you can show the normal mode as vectors:
- Click in the molecule window to make sure it has input focusUse arrow up key repeatedly to make the displacements largerUse arrow down key repeatedly to make the displacements smallerUse the left and right arrow keys to switch between modesUse the View → Displacement Vectors to visualize the normal mode with vectors
You can make the vectors larger or smaller using the same ctrl/cmd-L/K, or arrow up and down.
Another option is to show the normal mode in ADFmovie:
- Use the View → Open Mode In ADFmovie
If a mode is visible in ADFmovie you have some extra advanced options. For example, to make a mpg movie showing the mode.
We are done with this tutorial, so close all open ADF-GUI windows:
- SCM → Quit All