
Band structure with DFTB (SCC-DFTB, GFN1-xTB)
Calculate and plot an electronic band structure for a periodic solid with DFTB, including SCC-DFTB and GFN1-xTB variants.
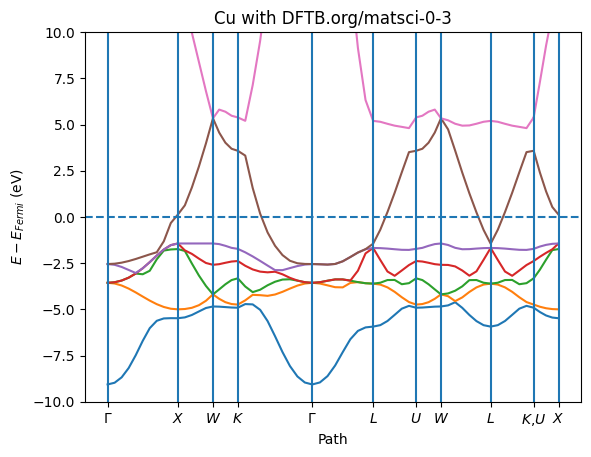
Metal band structure with SCC-DFTB
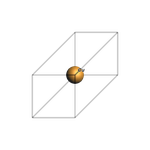
Build the primitive Cu unit cell:
from scm.plams import view
from scm.base import ChemicalSystem
from ase.build import bulk

Cu = ChemicalSystem.from_ase_atoms(bulk("Cu", "fcc", a=3.6))  # primitive cell
view(Cu, width=150, height=150, show_atom_labels=True)
Single-point calculation with SCC-DFTB and parameters DFTB.org/matsci-0-3:
from scm.inputs import AMS, DFTB
from scm.plams import AMSJob, Settings

s = Settings()
s.input = AMS(Task="SinglePoint")
s.input.Engine = DFTB(Model="SCC-DFTB", ResourcesDir="DFTB.org/matsci-0-3")
s.input.Engine.Periodic.BandStructure.Enabled = True
s.runscript.nproc = 1
job = AMSJob(settings=s, name="Cu", molecule=Cu)
job.run();
[08.10|11:13:37] JOB Cu STARTED
[08.10|11:13:37] JOB Cu RUNNING
[08.10|11:13:41] JOB Cu FINISHED
[08.10|11:13:42] JOB Cu SUCCESSFUL
from scm.plams.tools.plot import plot_band_structure
import matplotlib.pyplot as plt

x, y_spin_up, y_spin_down, labels, fermi_energy = job.results.get_band_structure(unit="eV")
ax = plot_band_structure(x, y_spin_up, None, labels, fermi_energy, zero="fermi")
ax.set_ylim(-10, 10)
ax.set_ylabel("$E - E_{Fermi}$ (eV)")
ax.set_xlabel("Path")
ax.set_title("Cu with DFTB.org/matsci-0-3")
ax;
Semiconductor band structure with GFN-1xTB
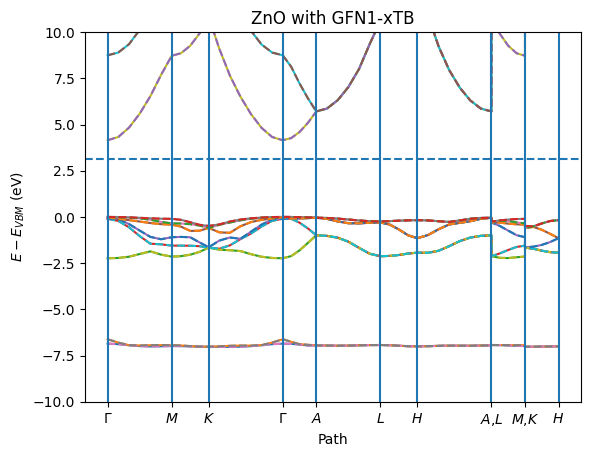
For a semiconductor like ZnO you can also choose to put the zero at the VBM (‘vbm’) or CBM (‘cbm’)
from scm.plams import view
from scm.base import ChemicalSystem
from ase.build import bulk

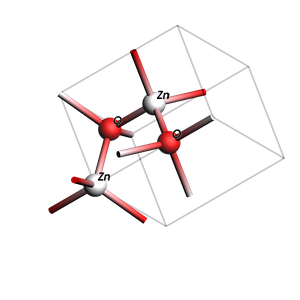
ZnO = ChemicalSystem.from_ase_atoms(bulk("ZnO", "wurtzite", a=3.2, c=5.3, u=0.375))
ZnO.guess_bonds()  # doesn't affect DFTB, just helps visualization
view(ZnO, direction="corner_z", width=300, height=300, show_atom_labels=True)
from scm.inputs import AMS, DFTB
from scm.plams import AMSJob, Settings

s = Settings()
s.input = AMS(Task="SinglePoint")
s.input.Engine = DFTB(Model="GFN1-xTB")
s.input.Engine.Periodic.BandStructure.Enabled = True
s.runscript.nproc = 1
job = AMSJob(settings=s, molecule=ZnO, name="ZnO")
job.run();
[08.10|11:13:43] JOB ZnO STARTED
[08.10|11:13:43] JOB ZnO RUNNING
[08.10|11:13:45] JOB ZnO FINISHED
[08.10|11:13:45] JOB ZnO SUCCESSFUL
The below call to plot_band_structure plots both the spin up and spin down. The spin-down bands are plotted as dashed lines. Note that in this case there is no spin polarization so the spin-down bands perfectly overlap the spin-up bands.
# get_band_structure returns an axis in AMS2025+
ax = plot_band_structure(*job.results.get_band_structure(unit="eV"), zero="vbmax")
ax.set_ylim(-10, 10)
ax.set_ylabel("$E - E_{VBM}$ (eV)")
ax.set_xlabel("Path")
ax.set_title("ZnO with GFN1-xTB")
ax;
See also
Python Script
#!/usr/bin/env python
# coding: utf-8

# ## Metal band structure with SCC-DFTB

# Build the primitive Cu unit cell:

from scm.plams import view
from scm.base import ChemicalSystem
from ase.build import bulk

Cu = ChemicalSystem.from_ase_atoms(bulk("Cu", "fcc", a=3.6))  # primitive cell
view(Cu, width=150, height=150, show_atom_labels=True, picture_path="picture1.png")


# Single-point calculation with SCC-DFTB and parameters `DFTB.org/matsci-0-3`:

from scm.inputs import AMS, DFTB
from scm.plams import AMSJob, Settings

s = Settings()
s.input = AMS(Task="SinglePoint")
s.input.Engine = DFTB(Model="SCC-DFTB", ResourcesDir="DFTB.org/matsci-0-3")
s.input.Engine.Periodic.BandStructure.Enabled = True
s.runscript.nproc = 1
job = AMSJob(settings=s, name="Cu", molecule=Cu)
job.run();


from scm.plams.tools.plot import plot_band_structure
import matplotlib.pyplot as plt

x, y_spin_up, y_spin_down, labels, fermi_energy = job.results.get_band_structure(unit="eV")
ax = plot_band_structure(x, y_spin_up, None, labels, fermi_energy, zero="fermi")
ax.set_ylim(-10, 10)
ax.set_ylabel("$E - E_{Fermi}$ (eV)")
ax.set_xlabel("Path")
ax.set_title("Cu with DFTB.org/matsci-0-3")
ax;
ax.figure.savefig("picture2.png")


# ## Semiconductor band structure with GFN-1xTB
#
# For a semiconductor like ZnO you can also choose to put the zero at the VBM ('vbm') or CBM ('cbm')

from scm.plams import view
from scm.base import ChemicalSystem
from ase.build import bulk

ZnO = ChemicalSystem.from_ase_atoms(bulk("ZnO", "wurtzite", a=3.2, c=5.3, u=0.375))
ZnO.guess_bonds()  # doesn't affect DFTB, just helps visualization
view(ZnO, direction="corner_z", width=300, height=300, show_atom_labels=True, picture_path="picture3.png")


from scm.inputs import AMS, DFTB
from scm.plams import AMSJob, Settings

s = Settings()
s.input = AMS(Task="SinglePoint")
s.input.Engine = DFTB(Model="GFN1-xTB")
s.input.Engine.Periodic.BandStructure.Enabled = True
s.runscript.nproc = 1
job = AMSJob(settings=s, molecule=ZnO, name="ZnO")
job.run();


# The below call to ``plot_band_structure`` plots both the spin up and spin down. The spin-down bands are plotted as dashed lines. Note that in this case there is no spin polarization so the spin-down bands perfectly overlap the spin-up bands.

# get_band_structure returns an axis in AMS2025+
ax = plot_band_structure(*job.results.get_band_structure(unit="eV"), zero="vbmax")
ax.set_ylim(-10, 10)
ax.set_ylabel("$E - E_{VBM}$ (eV)")
ax.set_xlabel("Path")
ax.set_title("ZnO with GFN1-xTB")
ax;
ax.figure.savefig("picture4.png")