Transition State Search with a Partial Hessian
This tutorial will teach you how to:
- Calculate a partial Hessian
- Do a constrained TS search using the partial Hessian
- Validate the TS by means of calculating IR frequencies
In this “advanced” tutorial we consider a slightly more realistic system. Some of the calculations may require 10 minutes to run on a two core machine.
Step 1: Create the system
We shall construct a \(\left(\sqrt{3}\times\sqrt{3}\right)\) super-cell of the graphene-(001) monolayer with two hydrogen atoms on top. Since the construction of a highly symemtric structure is cumbersome, just ‘copy & paste’ the following coordinates and lattice vectors into the opened ADFinput!
- Start ADFinput and switch to BAND‘Copy & Paste’ the coordinates and lattice vectors in the molecule drawing area.
\(\left(\sqrt{3}\times\sqrt{3}\right)\)-C(001) surface including two H atoms:
8

C       0.00000000       1.42028166       0.00000000
C       1.23000000       2.13042249       0.00000000
C       1.23000000      -0.71014083       0.00000000
C       2.46000000      -0.00000000       0.00000000
C       2.46000000       1.42028167       0.00000000
C       0.00000000       0.00000000       0.00000000
H       0.00000000       0.00000000       1.50000000
H       2.46000000       1.42028167       1.50000000
VEC1    3.69000000      -2.13042249       0.00000000
VEC2    0.00000000       4.26084499       0.00000000
Step 2: Calculate a partial Hessian
When optimizing a transition state structure, one possibility is to follow an imaginary eigenmode of the Hessian matrix. To do so, one has to pre-calculate this Hessian matrix and provide it later to the transition state optimization run. Here, we want to construct a partial Hessian, for which only the hydrogen atoms are free to move.
- Select the ‘BAND Main’ panel.Select the Frequencies task.

- Go to ‘Frequencies’ details by click on the ‘...’ button.Select with the mouse the hydrogen atoms.Click on the ‘+’ button next to Partial Hessian For:.

- File → Run, name the job H2onGraph_partHessian.adf.
Let us examine the eigen-modes that we have found for the hydrogen molecule
- Select the SCM → Spectra menu command.

There is 1 positive frequencies and one imaginary (negative) frequency. Convince yourself that the imaginary frequency results in a desorption of H2 from the surface. This mode is the most promissing one to follow regarding the transition state search.
Step 3: Transition state search with a frozen substrate
We have just found the vibrational modes of the Hydrogen molecule, assuming that the graphene monolayer remains fixed. Let us now find the transition state under the same assumption.
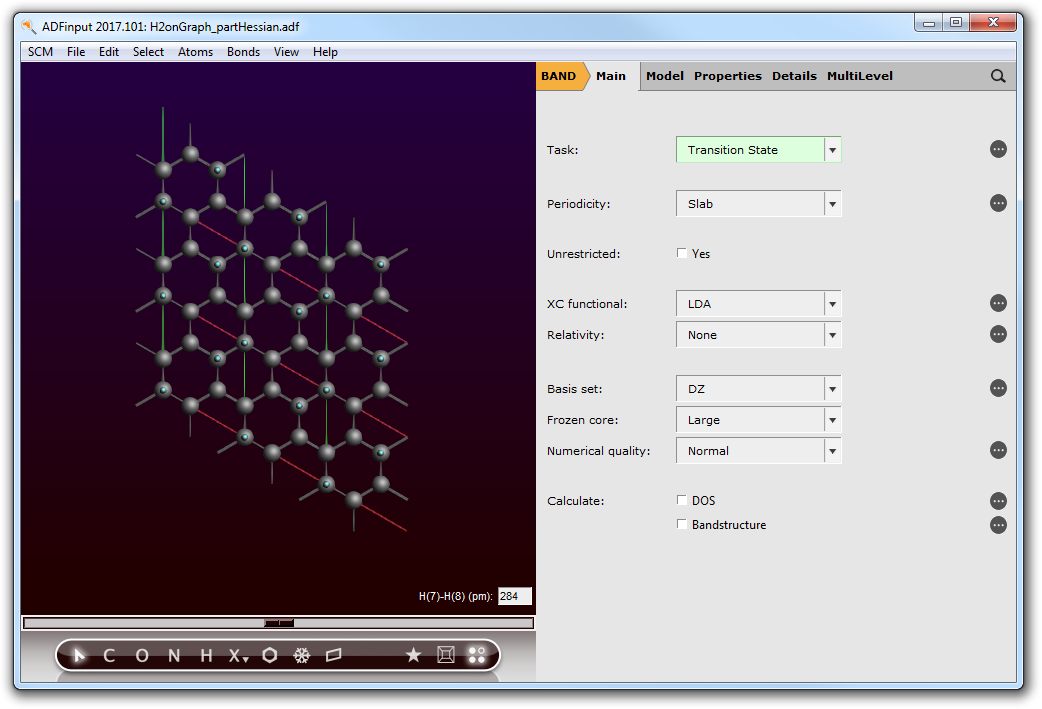
- Close the ADFspectra window and go back to BANDinput.Select the ‘BAND Main’ panel and set Task to Transition State Search.
- Panel bar Model → Geometry Constraints.Select the carbon atoms of the graphene monolayer and then click on the ‘+’ button next to freeze selected atoms.

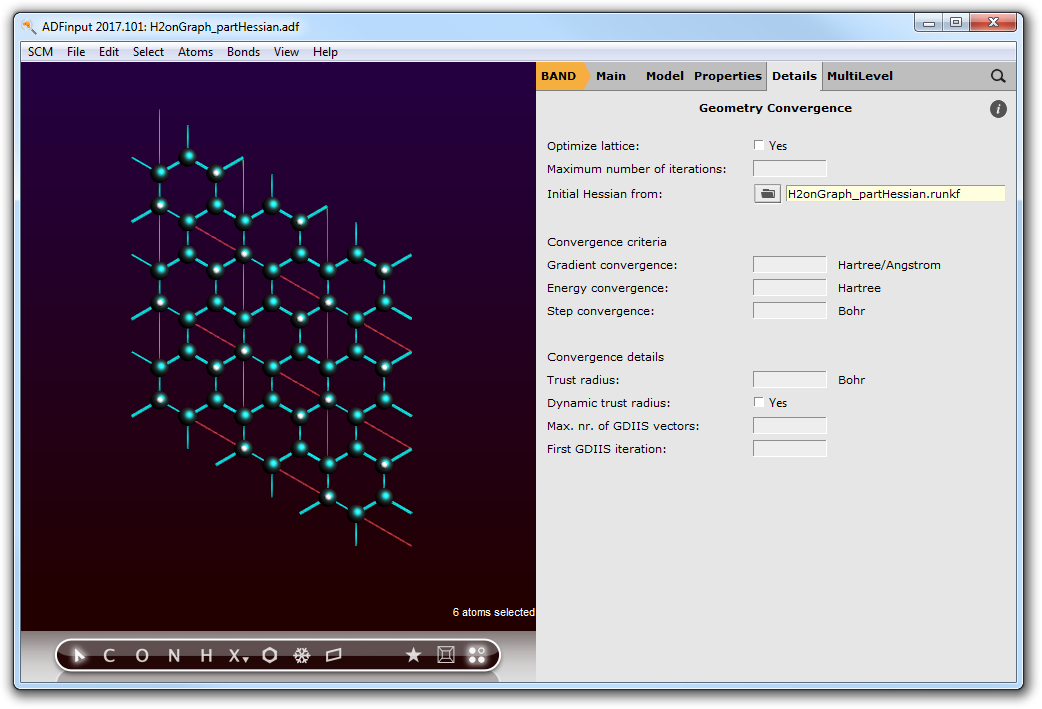
- Go to Geometry Convergence by click on the ‘...’ button next to Convergence details.Set Initial Hessian from: to H2onGraph_partHessian.runkf.
- File → Save As..., name the calculation H2onGraph_TS.adf.File → Run
After the run has completed we shall examine the optimization steps with the help of ADFmovie.
- SCM → Movie.In the movie window: Graph → Energy.Reorient to get a good look!
The presentation from ADFmovie including the graph should resemble the following picture.

Step 4: Verification
To verifiy that ‘Step 3’ actually found a local minimum with respect to the imaginary mode, one has to perform another frequency calculation like in ‘Step 2’.
- Close ADFmovie and go back to BANDinput.Select the ‘BAND Main’ panel.Set Task to Frequencies.Go to ‘Frequencies’ details panel by click on the ‘...’ button.Check that the two H atoms are still selected!File → Run, name the job H2onGraph_Verification.adf.Examine the IR spectra with the help of ADFspectra: SCM → Spectra.
