Polymer structures with the bond boost acceleration method
In this tutorial we will show how the bond boost acceleration method can be used to drive the non-catalyzed epoxide - amine polymerization reaction with the aim of generating highly crosslinked epoxy polymer structures:

Fig. 7 Epoxide - amine polymerization reaction
The goal is not to capture or simulate the kinetics of the polymerization reaction, but rather to generate realistic atomistic models of epoxy polymers which can used in further simulations (e.g. for prediction of mechanical properties)
This advanced ReaxFF tutorial is loosely based on the following publications:
- A. Vashisth, C. Ashraf, W. Zhang, C. E. Bakis, and Adri C. T. van Duin, J. Phys. Chem. A 2018, 122, 32, 6633-6642 (2018)
- M.S. Radue, B.D. Jensen, S. Gowtham, D.R. Klimek-McDonald, J.A. King and G.M. Odegard, J. Polym. Sci. B, 56, 255-264 (2018)
This tutorial requires the installation of AMS2019 for the bond boost acceleration method.
More details and information on other acceleration methods can be found in the ReaxFF manual:
Tip
See also the tutorial Mechanical properties of epoxy polymers
Setting up
The cross linking polymerization reaction occurs between the epoxy and the amine groups. The reaction is depicted in its simplest, non-catalyzed form in Fig. 7.
Throughout this tutorial the epoxy resin will be BisF whilst DETDA will be used as the hardener (amine):

You can either draw the 3D structures of these molecules with the GUI or download the xyz files:
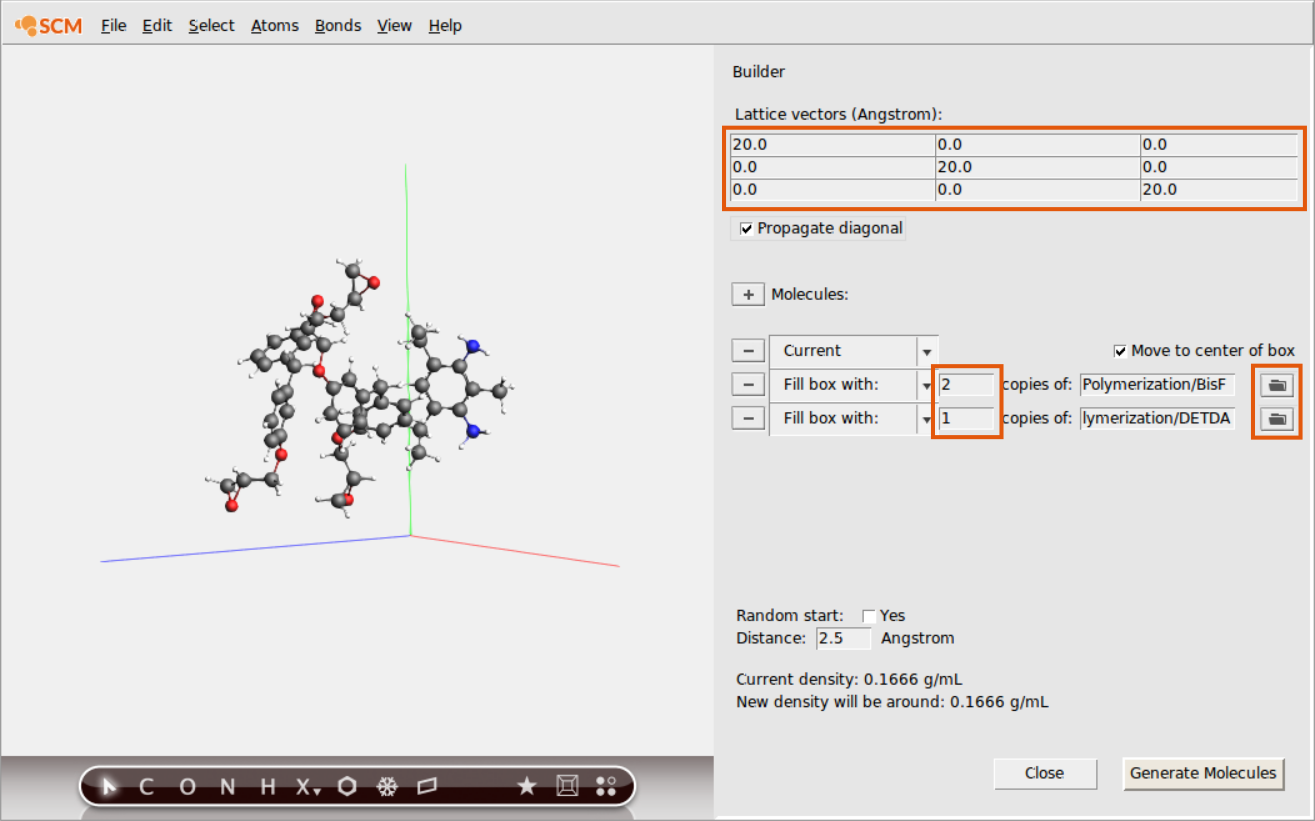
Use the builder functionality in AMSinput to fill a periodic box with one DETDA and two BisF molecules:
- Go to Edit → Builder to open the Packmol dialogEnter
20,20,20on the diagonal for the lattice vectorsClick on the Folder icon and select the file BisF.xyz you just downloadedClick on + button and open the file DETDA.xyzEnter2and1for BisF and DETDA respectivelyClick on Generate Molecules
To accelerate a reaction with the bond boost method, ReaxFF needs to be provided with a set of atom distances that define a preliminary complex which could lead up to the transition state of the reaction. If this complex is formed during the dynamics, external forces are applied to support bond breaking and bond formation for a user defined set of bonds. This ‘boost’ lasts for user defined time during which the reaction may or may not occur.
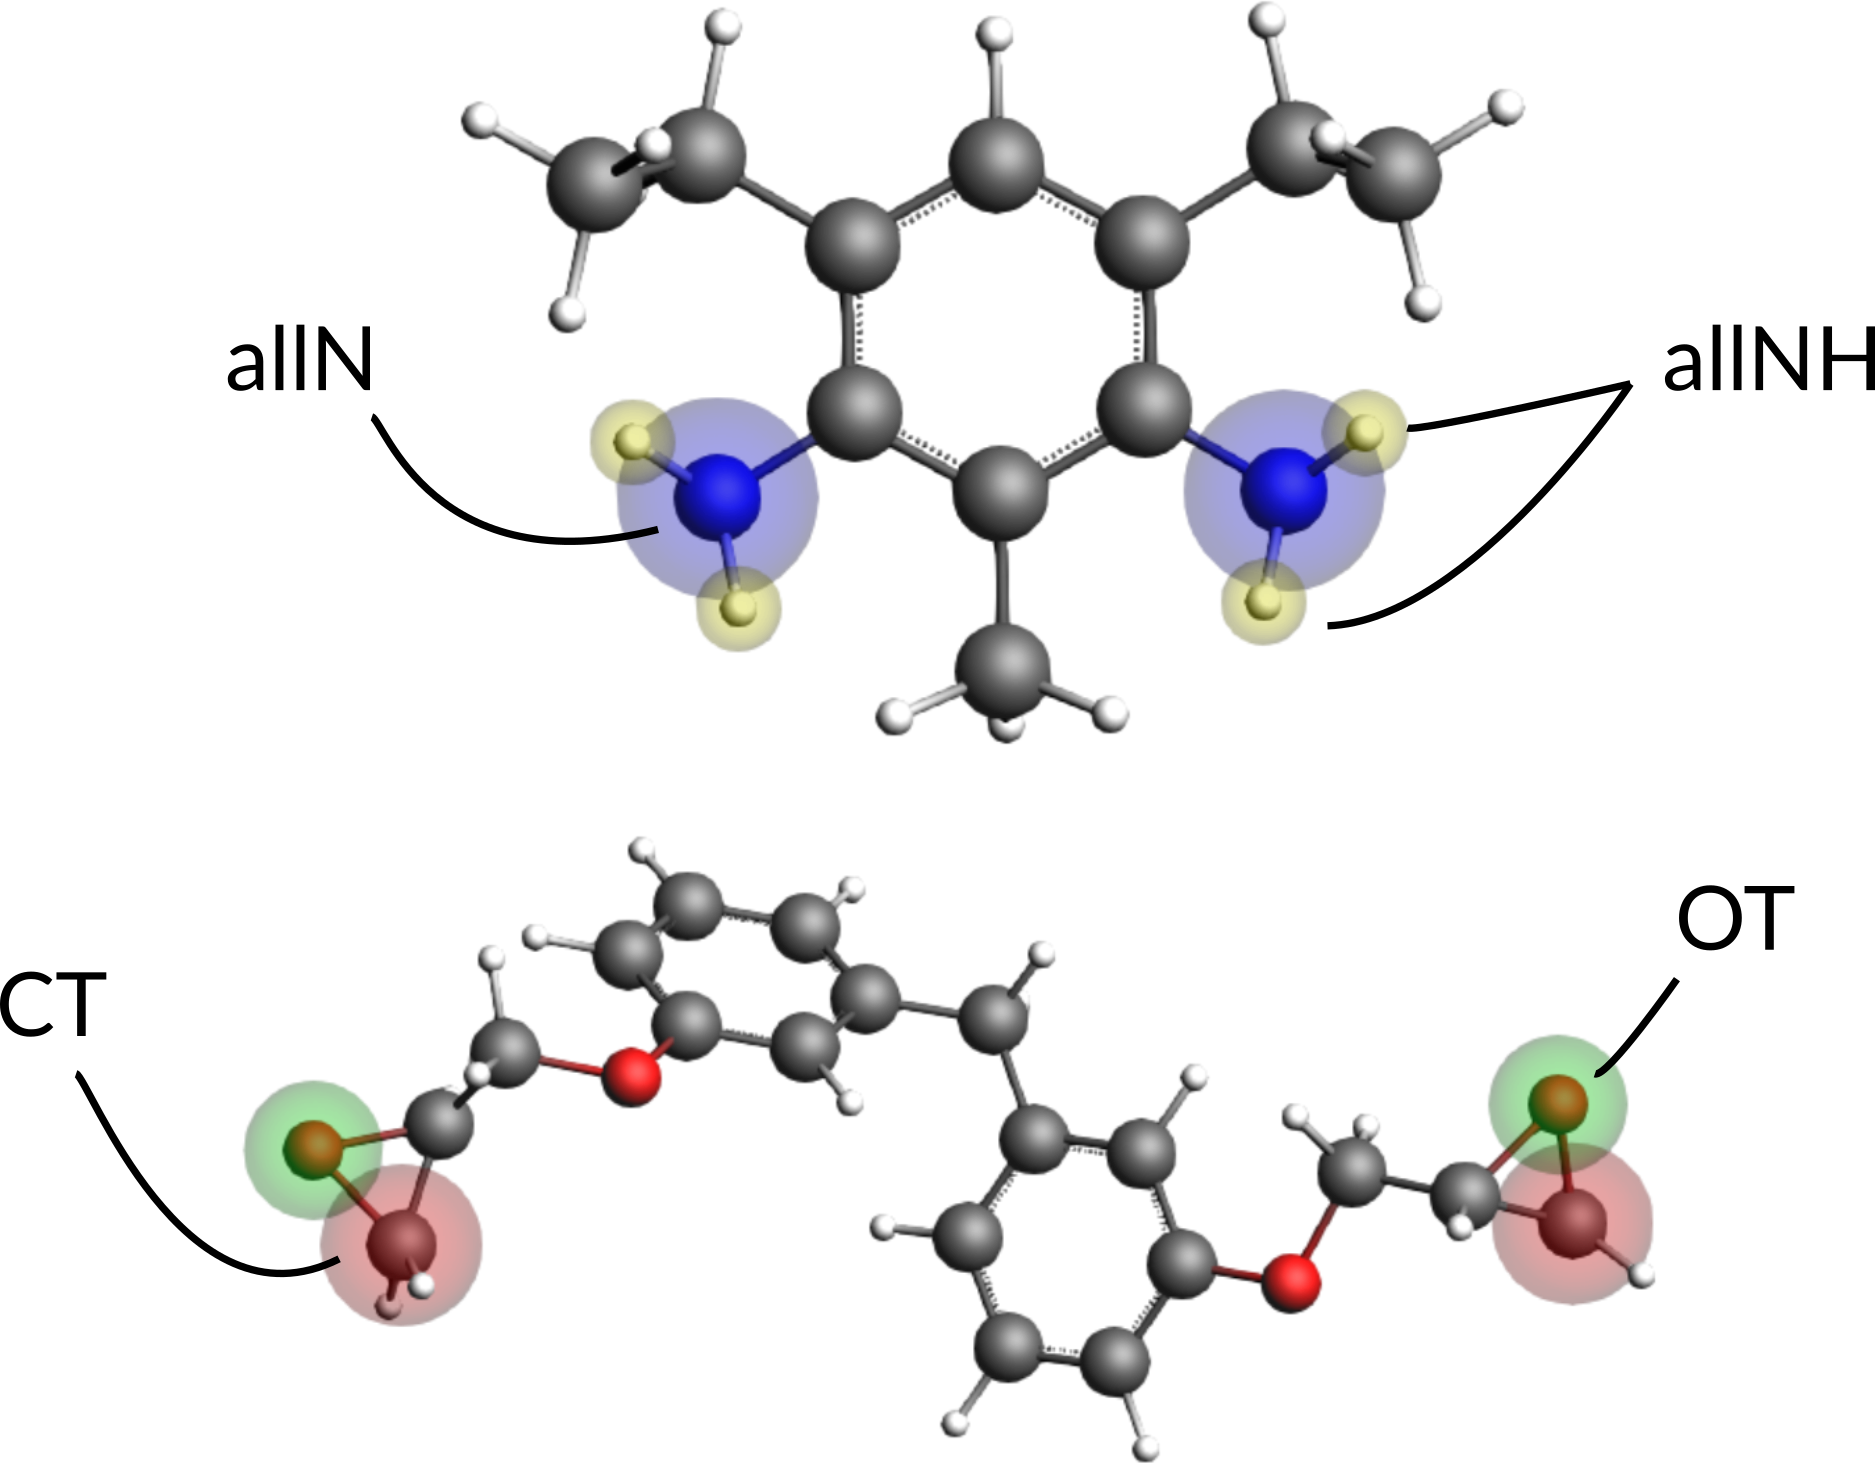
For the current reaction, a simple, yet effective set of atom distances are those between the N atom and the terminal C-atom of the epoxy group as well as the distance between the O-atom of the epoxy group to whichever H-atom of the amine group is closest:

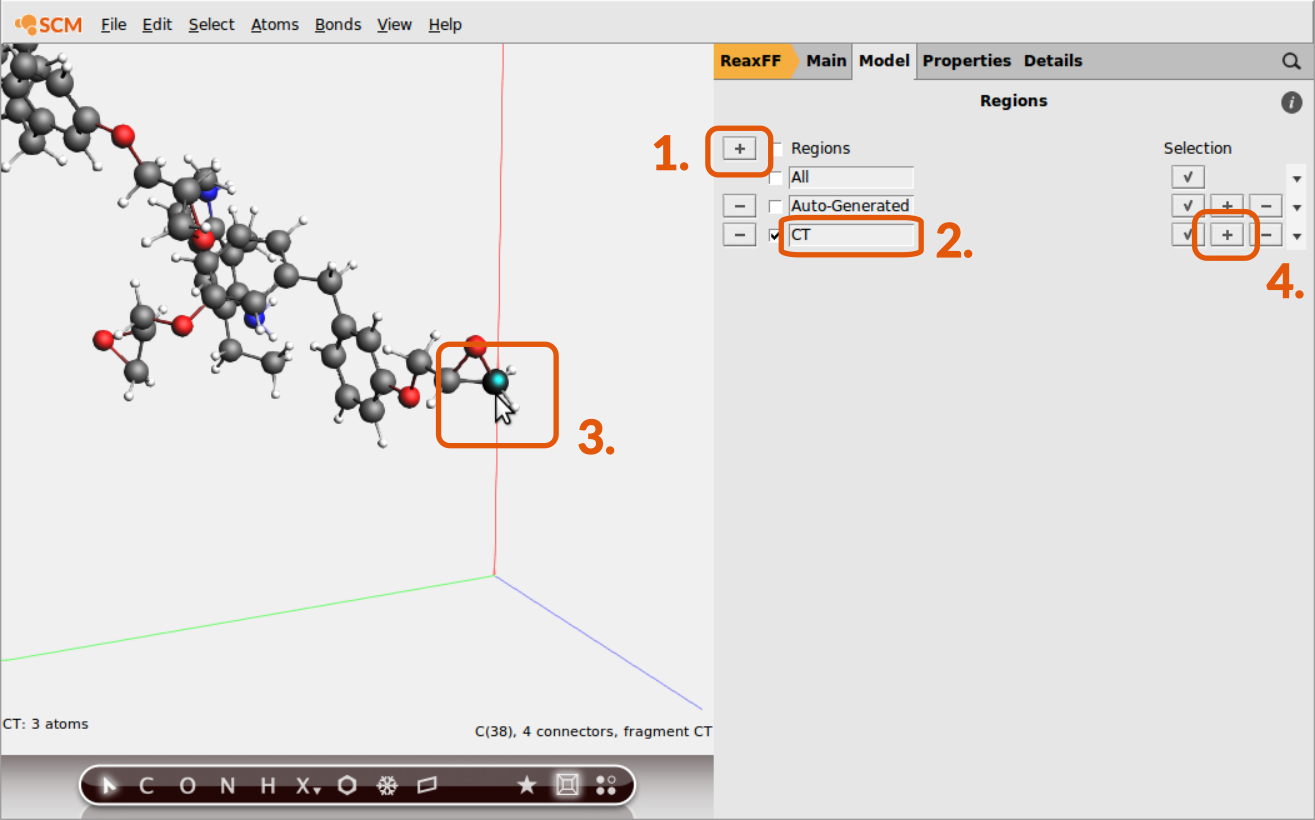
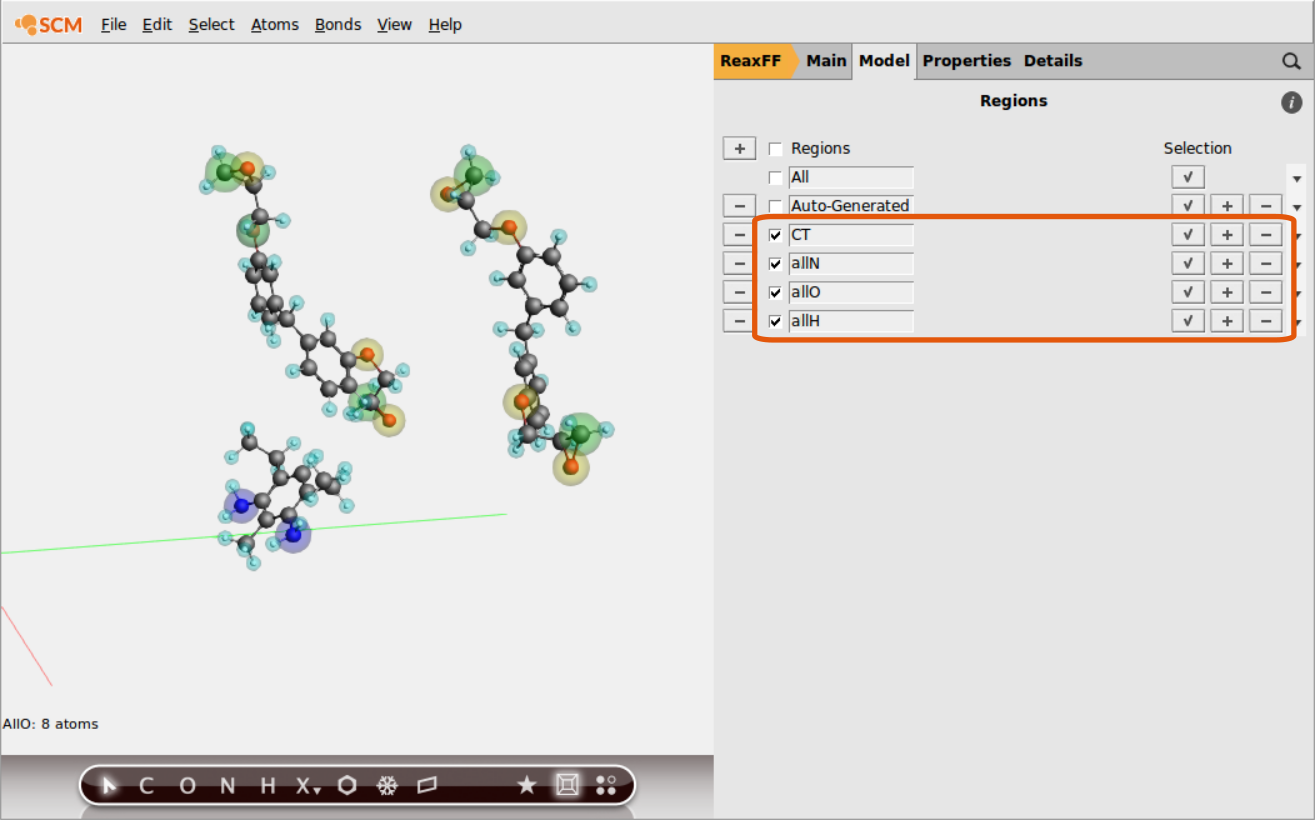
It is possible to distinguish atoms depending on their chemical environment, e.g. the terminal C-atom of the epoxy group, but the information needs to be provided via the regions model of ReaxFF by the user. To distinguish the terminal C-atom from all other C-atoms in the system, a CT region needs to be setup:
- Go to Model → RegionsClick + button next to Regions on the topEnter a suitable name for the new region
CTSelect a terminal C-atom in the molecule panelClick on the + button next to theCTregion
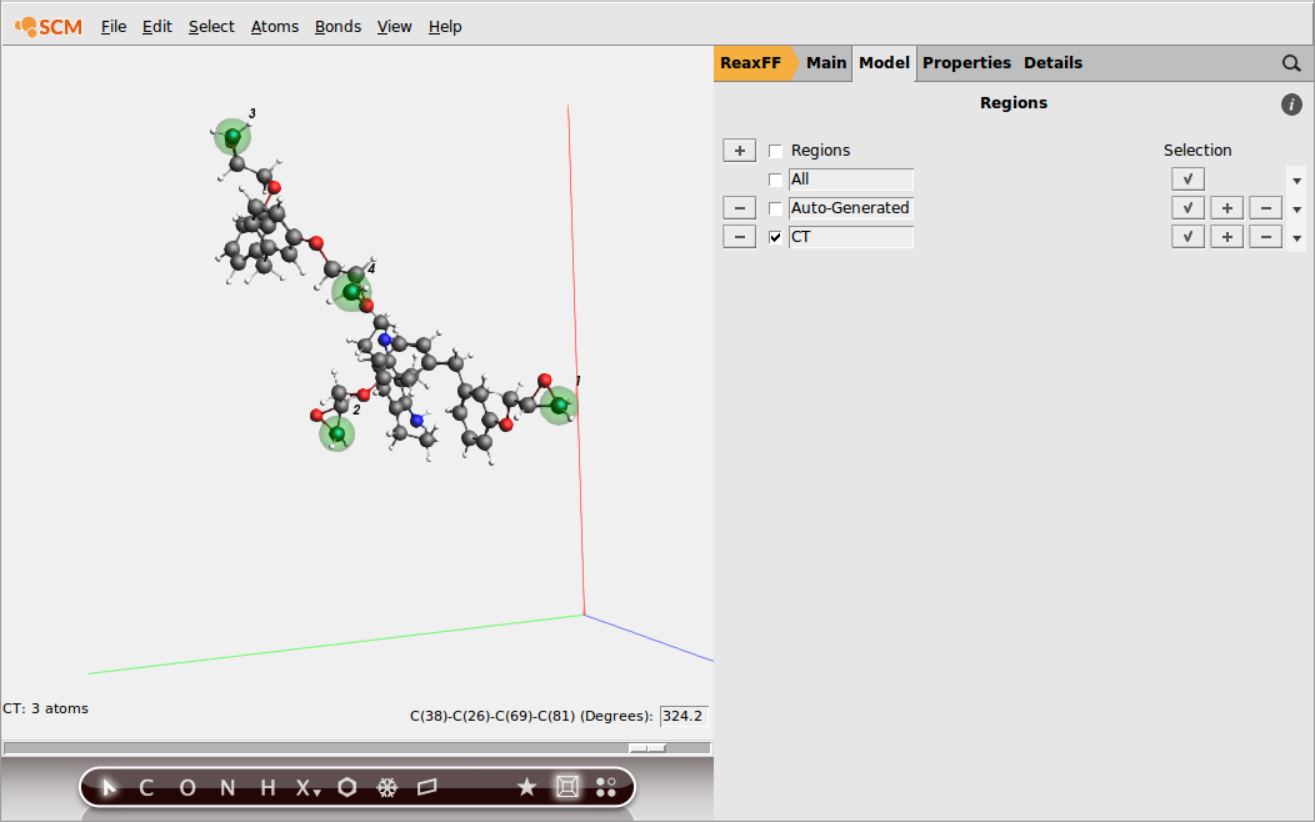
Repeat steps 3. and 4. to add all other terminal C-atoms to the new CT region
Tip
You can hold down the SHIFT key to select multiple atoms in the molecule view.
Tip
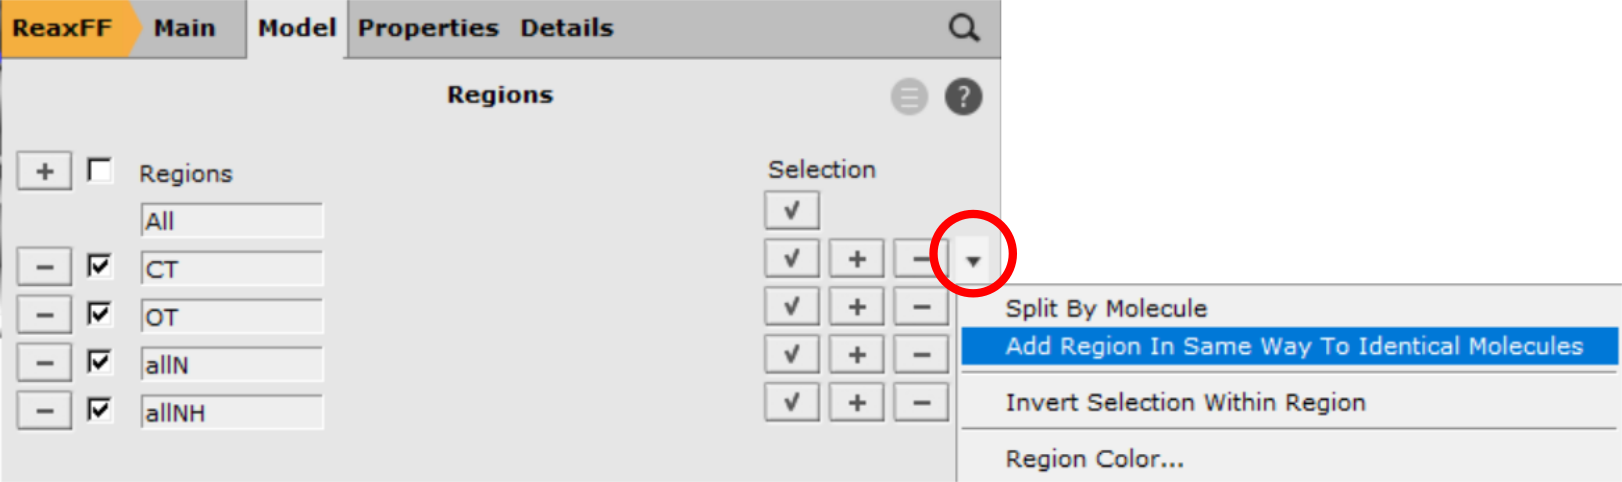
If you have multiple identical molecules, the region can be copied over in the Regions panel using the ‘Apply To Identical Molecules’ option from the dropdown menu on the right.
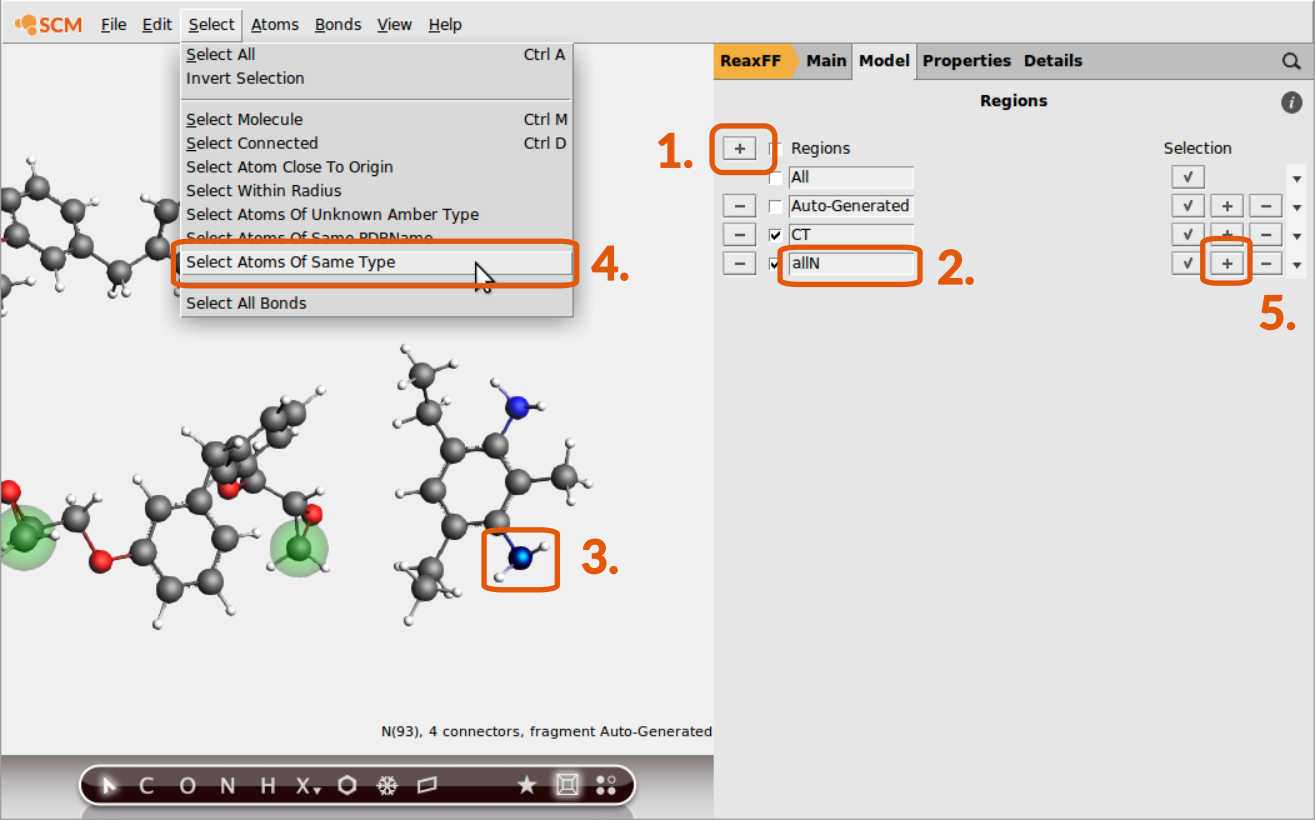
Now the subset of terminal C-atoms can be distinguished via referring to the region CT as we’ll see later. The other regions are consisting of all N-,O- and H-atoms. To set up a region with all N-atoms:
- Create a new region: Click + button next to RegionsEnter a suitable name:
allNSelect one N-atomGo to Select → Select Atoms Of Same TypeClick on the + button next to theallNregion
Tip
Make sure that the atoms of the previous region assignment are not selected anymore when assigning a new region. Trying to assign one atom to multiple regions is a common source of error.
Continue setting up regions containing all O- and H-atoms respectively:
Once the regions are set up, we can use them to define a tracking regime for the bond boost. The set of atom distances that will switch on the boost once all criteria are met is
to set this up in the GUI
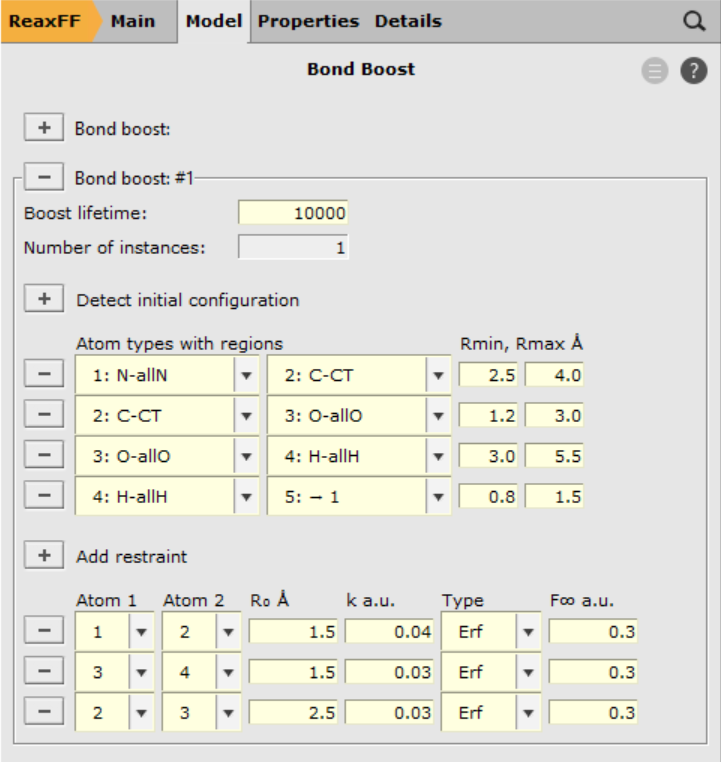
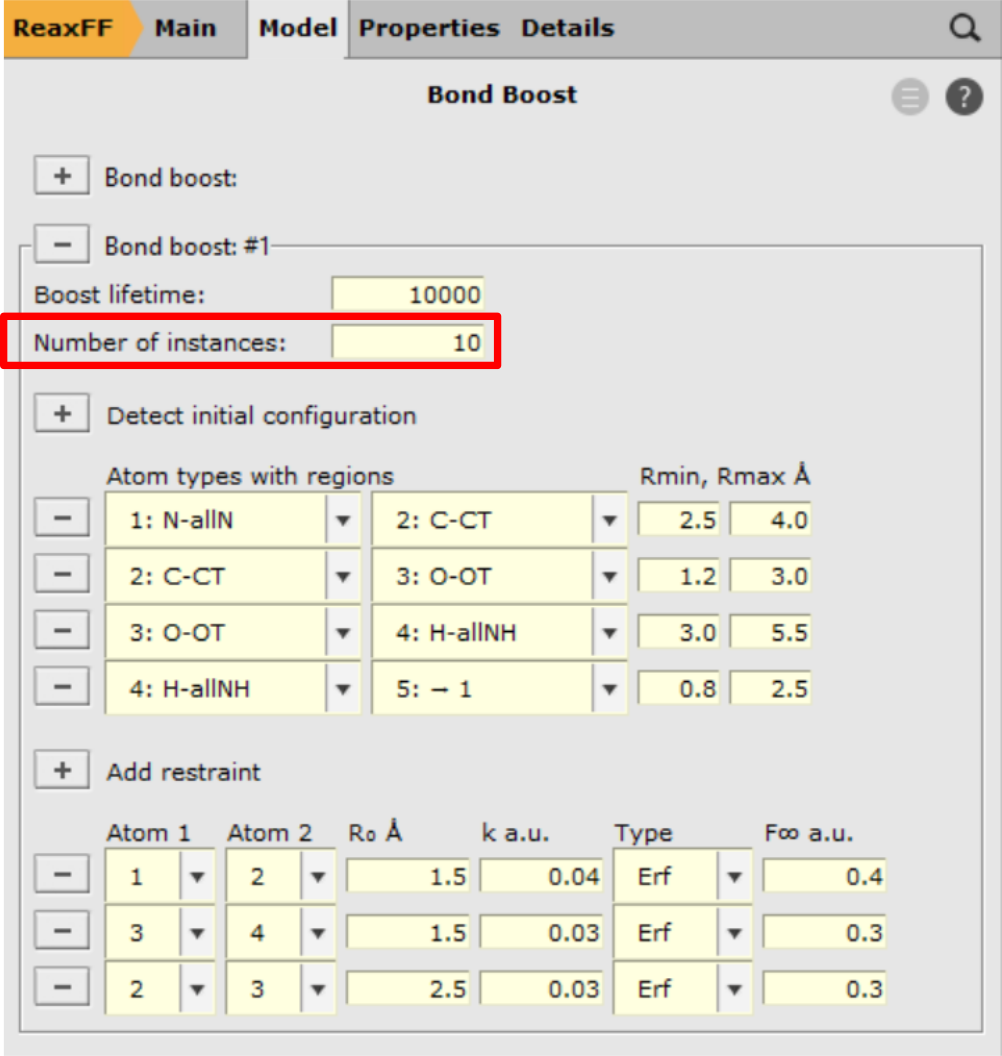
- Go Model → Bond boostClick on the + button next to Bond boostEnter
10000for the Boost lifetimeClick on the + button next to Detect initial configurationFrom Atom types with regions menu, select N-allN and C-CTSet Rmin to2.4and Rmax to4.0
Continue with assigning the other tracking options:
- C-CT / O-allO
1.2-3.0 - O-allO / H-allH
3.0-5.5 - H-allH / →**1**
0.8-1.5
Note
Note the last atom type is set to be →**1** to specify that it must be the initially detected Nitrogen atom, i.e. the one close to CT.
The boost settings are chosen such that the following logic is implemented
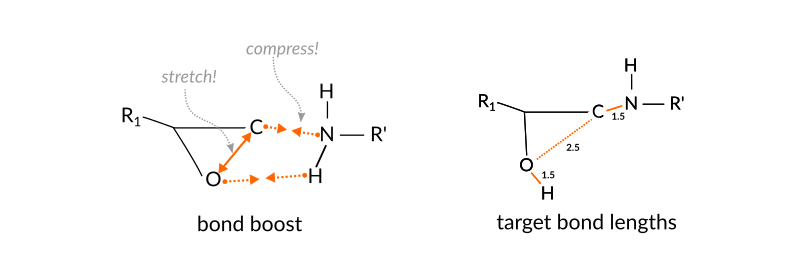
the aim is to support the breaking and forming of bonds but still allow the reaction to fail.
Note
The above settings have been chosen empirically. A more thorough assessment of energetics based on ab initio calculations is presented in the publication by A. Vashisth et al.
The bond boost options are defined in the lower part of the bond boost panel
- Click on the + next to Add restraintChoose the atoms 1 and 2 from the dropdown menuSet R0(target bond length) to
1.5Set k to0.04, the type to Erf and the max. force F∞ to0.4
Note
The maximum allowed Force, F∞, is the most important parameter. It is important that it’s not too large because it may just rip the reactants apart if the force is too large We found, for example, that with 0.5 it’s often ripping them apart, while with 0.3 it’s much less likely but still possible. With 0.2 the reaction takes longer but should give more reasonable results in the end. The force constant value seems to be much less essential.
Continue with assigning two more boosts:
- 3 / 4
1.5,0.03,0.30 - 2 / 3
2.5,0.03,0.30
Execution and visualization
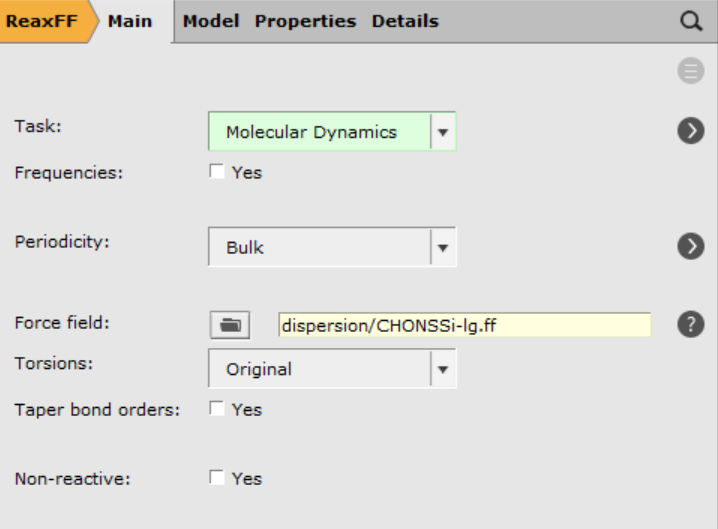
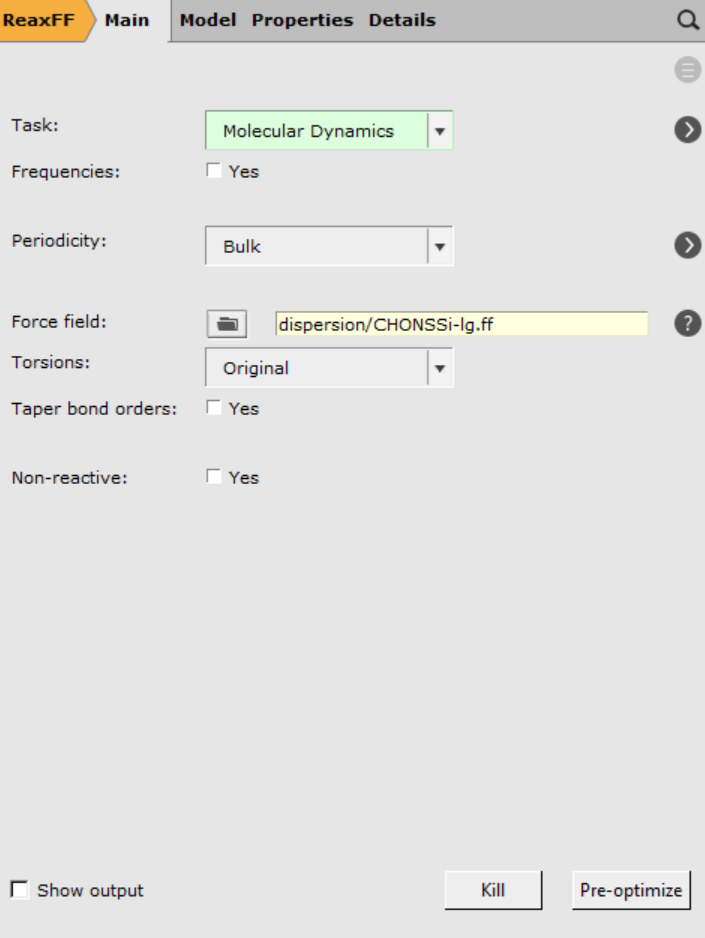
After completing the setup of the bond boost in the previous chapter, we can test the boost by running a small NVT trajectory. Choose the following general ReaxFF settings from the main panel
- Task → Molecular DynamicsForce field
dispersion/CHONSSi-lg.ff
Note
This tutorial employs the dispersion corrected force field, that has not been optimized for usage with the bond boost.
This force field has been used successfully in the study by M.S. Radue et al.
The results might be improved by using the force field CHON2017_weak_bb.ff fitted for usage with the bond boost method (A. Vashisth et al. ).
However, note that switching the force field will require tweaking the bond boost settings.
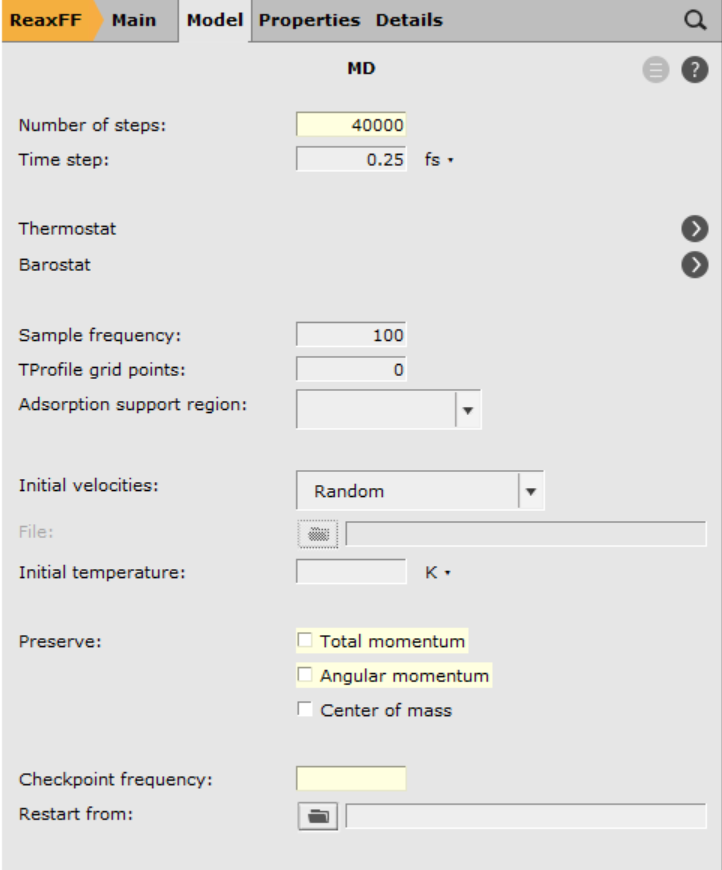
Open the MD settings:
- Click on
 next to Molecular DynamicsFor Number of steps: enter
40000
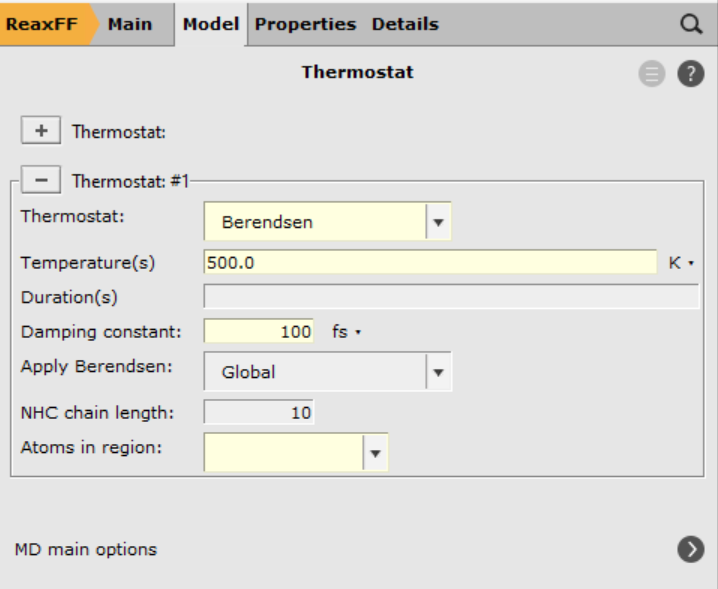
Open the thermostat settings:
- Click on next to ThermostatClick on
 next to ThermostatSelect Thermostat → Berendsen and Damping constant
100.0Set Temperature500.0
Save and run the calculation:
- File → SaveFile → Run
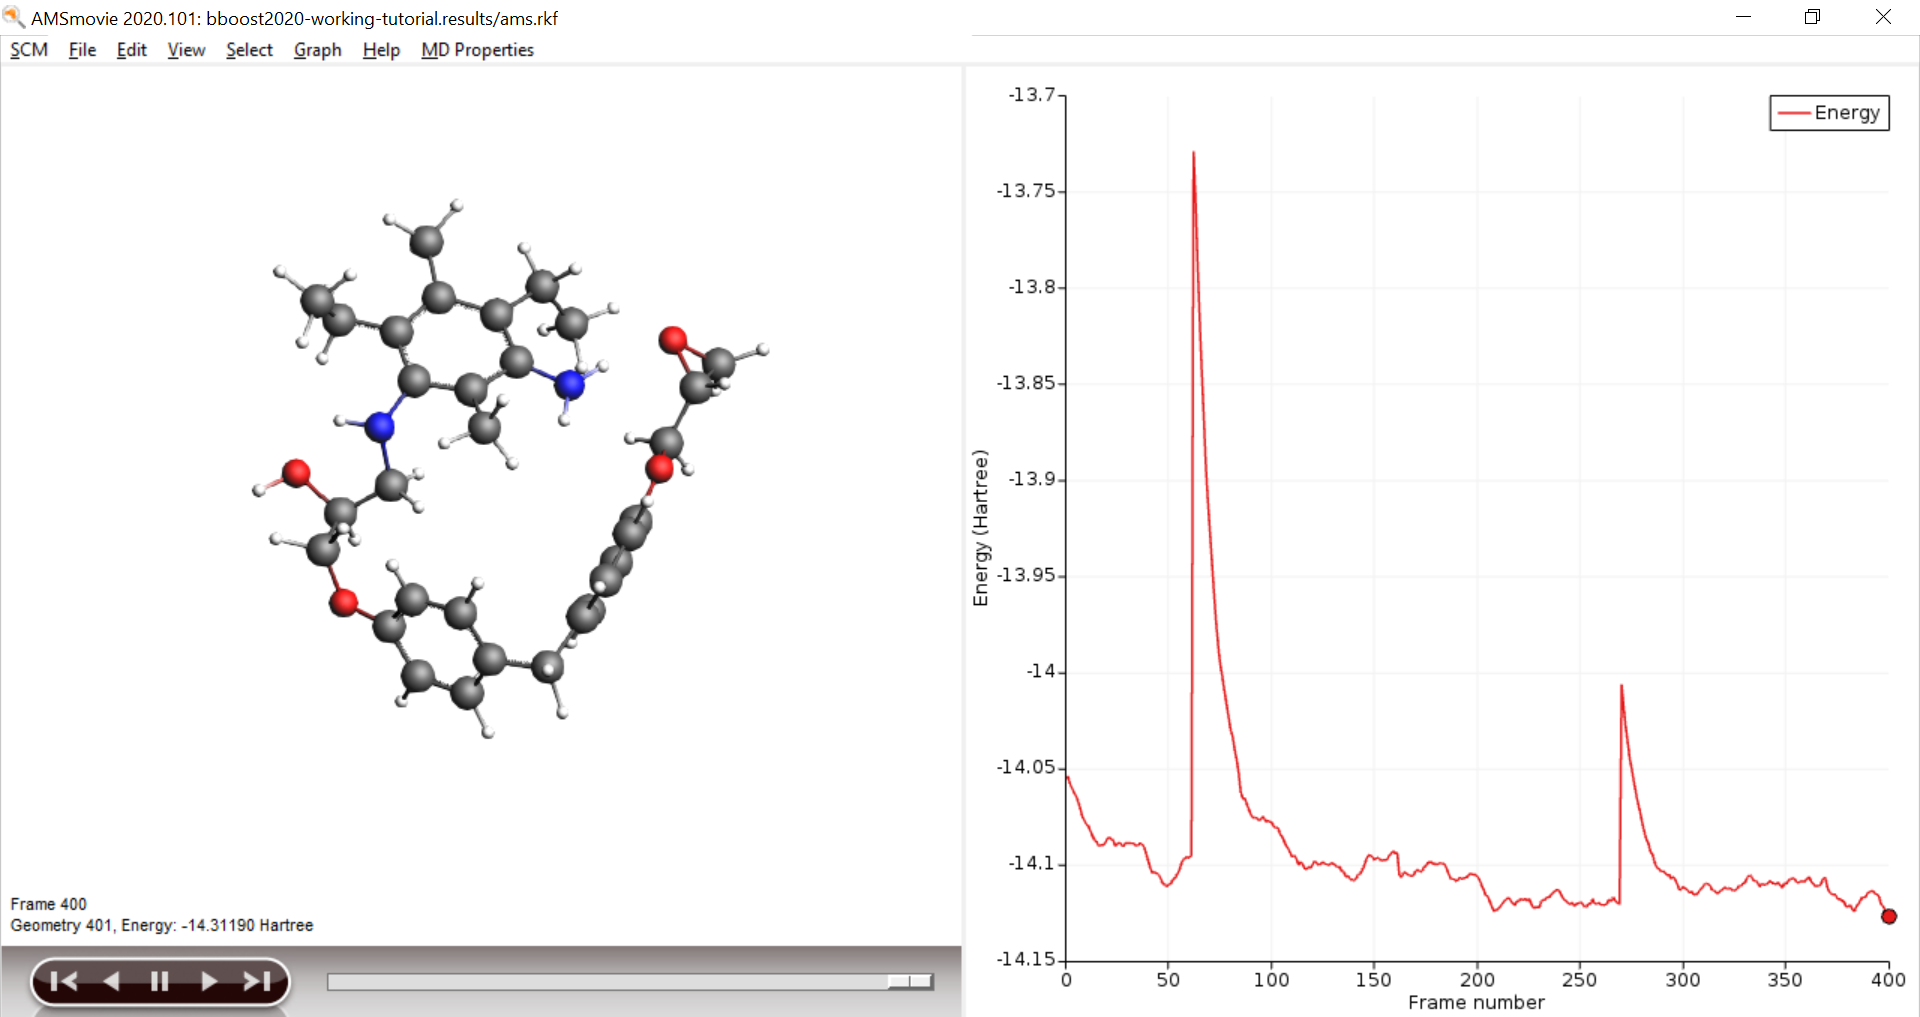
Open AMSmovie and follow the calculation of the trajectory, you should see at least one successful cross linking reaction. The boost periods are visible as kinks in the energy graph
- Properties → Number of Molecules
Scaling it up: Generate large Polymer structures
For simulation of polymer properties much larger structures are needed. In the following chapter, we will explain how to scale up the bond boost simulation to more realistic systems up to several thousand atoms.
Open a new AMSinput window
- From the SCM Menu
 select New InputChange to
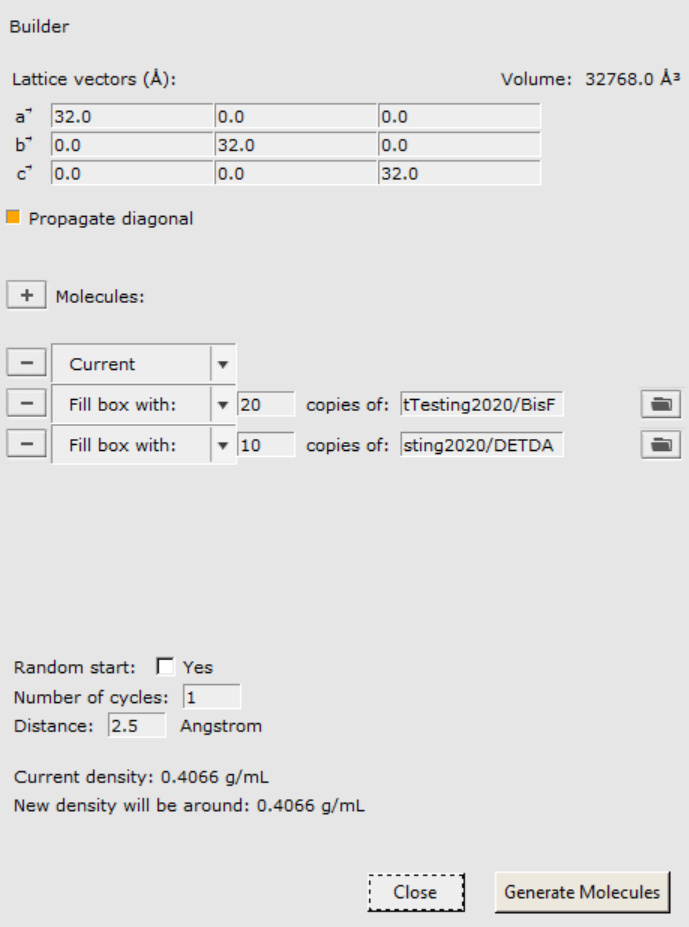
open the Packmol builder to create a larger initial structure. Set up a periodic box with with 20 BisF epoxy and 10 DETDA hardener molecules. Make sure that the density displayed in the bottom panel of builder panel is around 0.4 g/mL otherwise packing the molecules will become a hard task and some might even not fit at all. With that criterion in mind, a good box size seems to 32 Å.
- Edit → BuilderPut
32.0on diagonal of the lattice vectors panelClick to downloadherethe .xyz file BisF.xyzClick to downloadherethe .xyz file DETDA.xyzClick on the Folder to import20BisF moleculesClick on the next to Molecules, and import another 10DETDA moleculesClick on the Generate Molecules button
Next we need to assign regions to one BisF and one DETDA molecule. One molecule of each species will suffice. It’s possible to translate regions to identical molecules across the whole periodic as we shall see now.
Assign the following regions to one of the DETDA and one of BisF molecules:
To assign the same regions to all other molecules automatically
- Select Add region in same to… from the region dropdown menuRepeat this step for all regions you have assigned
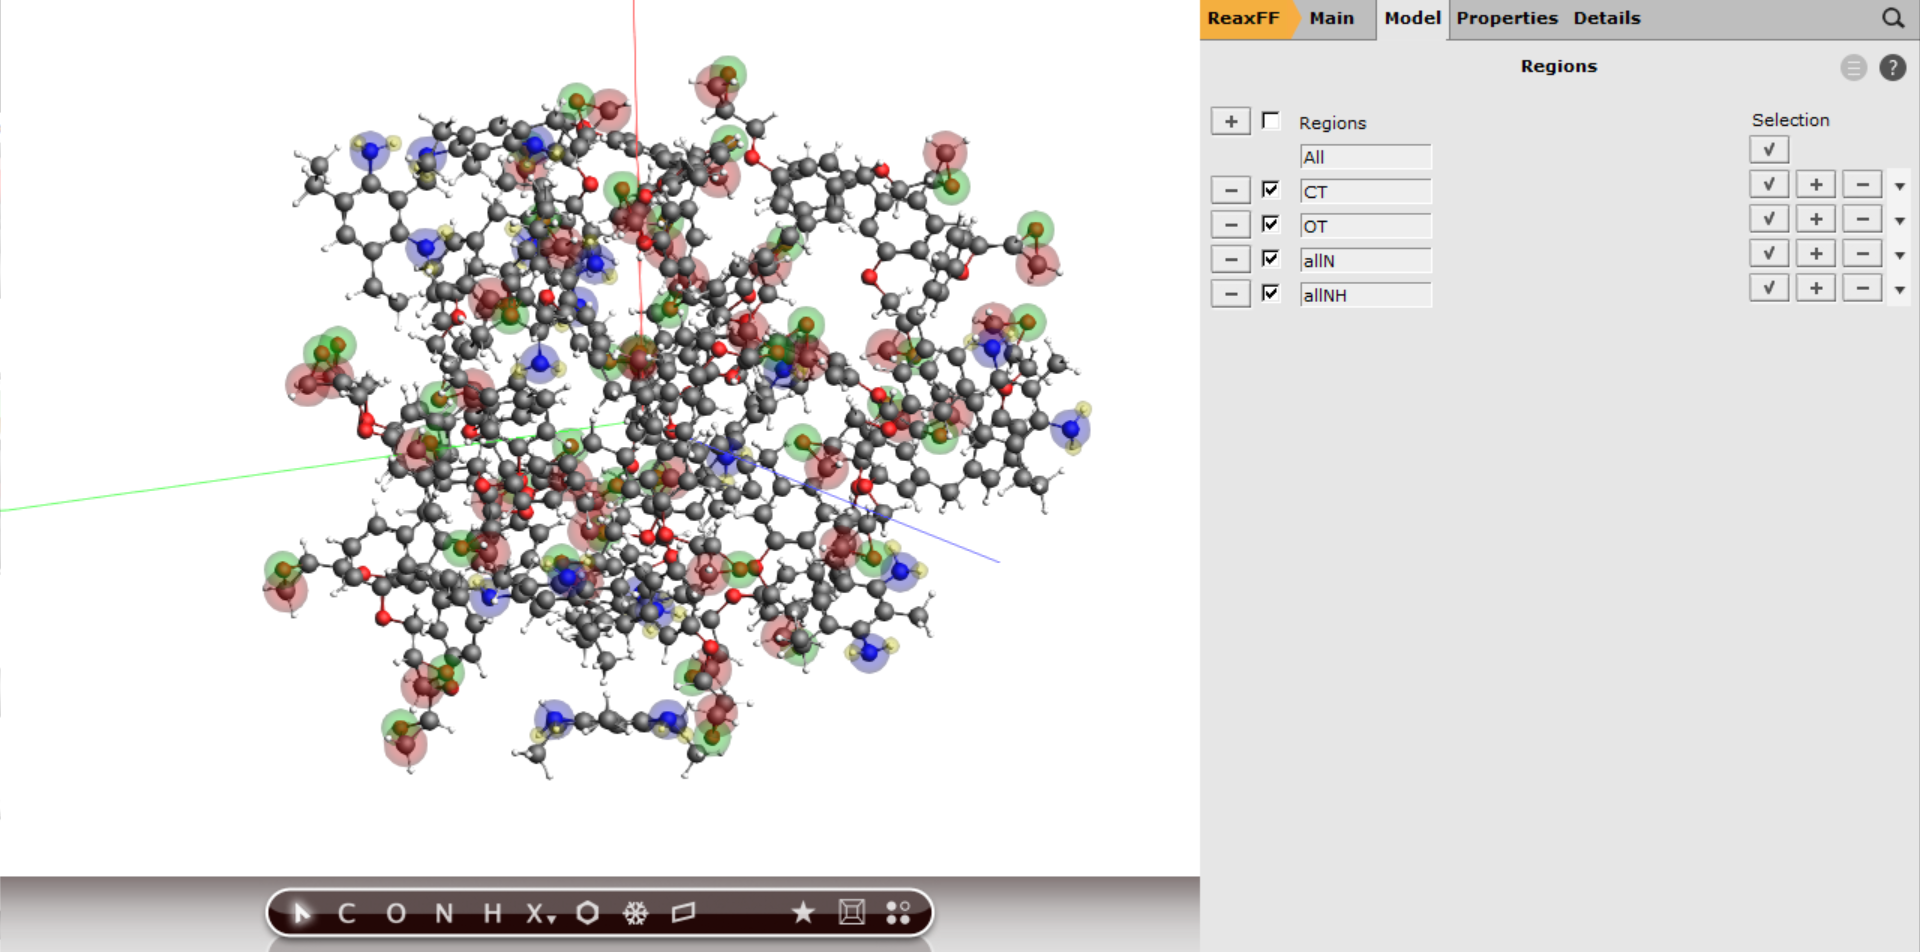
Your periodic box with all the regions automatically assign should now look like this
Next we can assign the tracking for the bond bosst using the same logic as before with the exception of requesting more bond boost instances. The instances refer to the number of simultaneously boosted reactions. Since we have ten amines, i.e. ten reaction sites, we could in principle expect ten simultaneous reactions (not counting double reactions on the same amine group).
Now only the MD settings need to be set.
- Switch to the Main panelTask → Molecular DynamicsForce field
dispersion/CHONSSi-lg.ff
This time we shall run the simulation for a longer time. To increase the efficiency of the calculation, we will lower the framerate from writing a snapshot every 100th to every 1000th MD step.
Open the MD settings:
- Click on next to Molecular DynamicsFor Number of steps: enter
250000
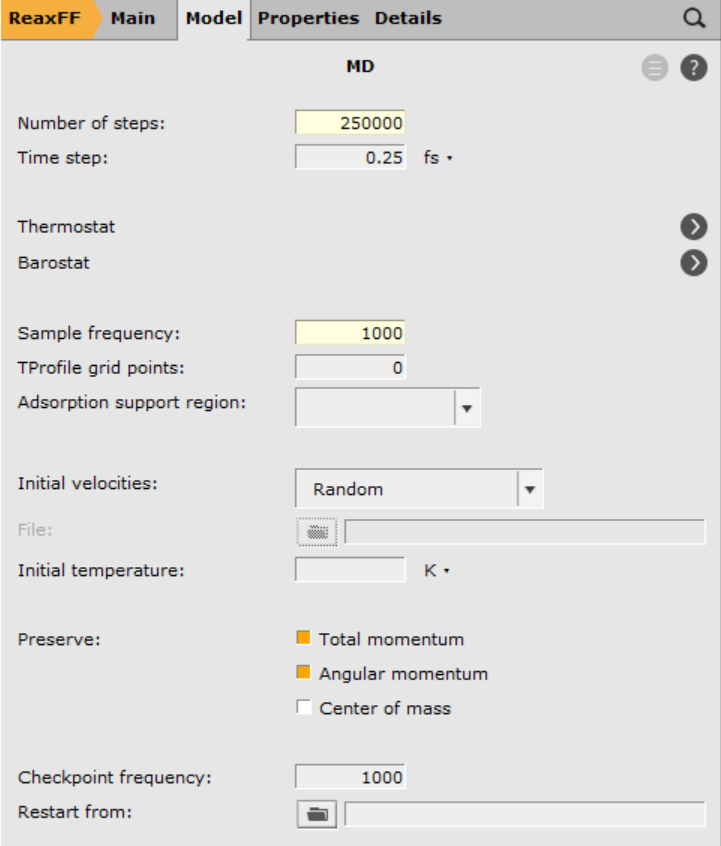
We use the same thermostat as before but will add a barostat:
- Click on next to ThermostatClick on next to ThermostatSelect Thermostat → Berendsen and Damping constant
100.0Set Temperature500.0
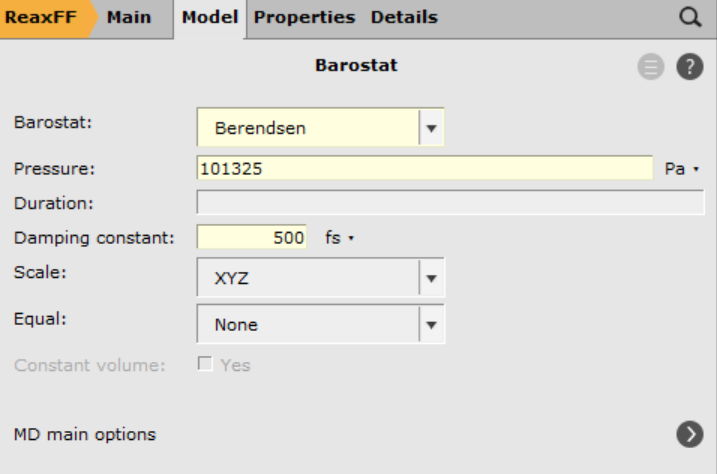
- Click on next to MD main optionsClick on next to BarostatSelect Barostat → Berendsen and Pressure
101325Pa (1 atm)Set Damping constant to500.0fs
Save and run the calculation:
- File → SaveFile → Run
Analysis: Calculate the density and cross-linking ratio
The trajectory can be monitored in AMSmovie, though it becomes increasingly tough to spot the reactions with such huge systems. For this reason, we provide a special analysis tool that allows you to monitor the progress of the systems cross-linking via the cross-linking ratio.
- Click to download the script
cross-link-density.pyPlace the script in the same folder where your .ams inputfile is locatedon Windows and Mac, open a command line from AMSinput Help → Command line (windows) or Help → Terminaltype bash and hit ENTER
Note
You can find more information on PLAMS and AMS scripting in the Getting starte section of the scripting documentation.
To run the script execute the following command in the command line:
$AMSBIN/plams cross-link-density.py -v resultsdir=ams.results
The script will print the results onto the command line as follows:
...
( 174/ 189) 44.000 0.600
( 175/ 189) 44.000 0.600
( 176/ 189) 44.000 0.600
( 177/ 189) 43.000 0.575
( 178/ 189) 43.000 0.575
( 179/ 189) 44.000 0.600
( 180/ 189) 42.000 0.550
( 181/ 189) 43.000 0.575
( 182/ 189) 43.000 0.575
( 183/ 189) 43.000 0.575
( 184/ 189) 42.000 0.550
( 185/ 189) 42.000 0.550
( 186/ 189) 42.000 0.550
( 187/ 189) 42.000 0.550
( 188/ 189) 42.000 0.550
( 189/ 189) 40.000 0.500

  Final density: 0.407
  Cross-linking ratio: 0.500
Where the values in parentheses refer to the current analyzed frame and the total number of frames. The second column is the total number of C-N bonds found in the system at that frame and the third column is the cross-linking ratio computed as the ratio between newly formed CN-bonds and number of theoretically possible CN bonds (two new bonds per amine group).
Note
Obviously the density has not yet converged to the experimental value. Wether or not it’s possible to just extend the simulated timescale, depends on the system. Often it helps to run one or several simulated annealing runs with such a cross-linked polymer structure to eliminate local density hot spots or vacuum bubbles in the structures. An enlightening discussion can be found in computational details of A. Vashisth, C. Ashraf, W. Zhang, C. E. Bakis, and Adri C. T. van Duin, J. Phys. Chem. A 2018, 122, 32, 6633-6642 (2018)