Helium Dimer Dissociation Curve with ADF
Calculate energy-vs-distance for the helium dimer and compare the resulting energies point by point.
Initial Imports
import numpy as np
import pandas as pd
from scm.base import ChemicalSystem, Bond, Units
from scm.plams import Settings, AMSJob, view
Setup Dimer
We first create initial system of two Helium atoms at some minimum separation.
d_min = 2.2
d_max = 4.2

he_dimer = ChemicalSystem()
he_dimer.add_atom("He", coords=[0.0, 0.0, 0.0])
he_dimer.add_atom("He", coords=[d_min, 0.0, 0.0])
he_dimer.bonds.add_bond(0, 1, Bond(1.0))
print(he_dimer)
System
   Atoms
      He 0 0 0
      He 2.2 0 0
   End
   BondOrders
      1 2 1
   End
End
Calculation Settings
We then set up the calculation settings. We will perform a PES scan over the He-He bond, taking 11 distances in our chosen range. For the engine we will use ADF with TZP/PBE+GrimmeD3.
settings = Settings()
settings.input.ams.task = "PESScan"
settings.input.ams.pesscan.scancoordinate.npoints = 11
settings.input.ams.pesscan.scancoordinate.distance = f"1 2 {d_min} {d_max}"
settings.input.adf.basis.type = "TZP"
settings.input.adf.xc.gga = "PBE"
settings.input.adf.xc.dispersion = "Grimme3"
Create and Run PESScan Job
The PES scan can now be run:
job = AMSJob(molecule=he_dimer, settings=settings)
job.run()
[09.04|17:55:44] JOB plamsjob STARTED
[09.04|17:55:44] JOB plamsjob RUNNING
[09.04|17:55:51] JOB plamsjob FINISHED
[09.04|17:55:51] JOB plamsjob SUCCESSFUL


<scm.plams.interfaces.adfsuite.ams.AMSResults at 0x12a396a60>
Results
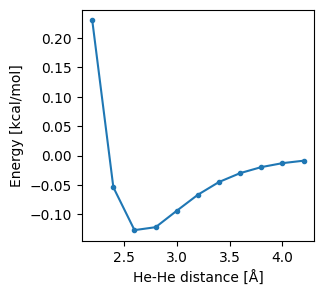
Results can be easily extracted using the get_pesscan_results method. We plot the energy as a function of the bond length, and the geometries either various points along the curve.
import pandas as pd

results = job.results.get_pesscan_results()
df = pd.DataFrame({"Distance": results["RaveledPESCoords"][0], "Energy": results["PES"]})
df["Distance"] *= Units.conversion_factor("Bohr", "Angstrom")
df["Energy"] *= Units.conversion_factor("Hartree", "kcal/mol")
df
Distance | Energy | |
|---|---|---|
0 | 2.2 | 0.230174 |
1 | 2.4 | -0.053810 |
2 | 2.6 | -0.126581 |
3 | 2.8 | -0.121580 |
4 | 3.0 | -0.093658 |
5 | 3.2 | -0.066451 |
6 | 3.4 | -0.044789 |
7 | 3.6 | -0.029741 |
8 | 3.8 | -0.019515 |
9 | 4.0 | -0.012803 |
10 | 4.2 | -0.008633 |
import matplotlib.pyplot as plt

fig, ax = plt.subplots(figsize=(3, 3))
ax.plot(df["Distance"], df["Energy"], ".-")
ax.set_xlabel("He-He distance [Å]")
ax.set_ylabel("Energy [kcal/mol]")
ax;
idx_min = df["Energy"].idxmin()

print(
    f"Minimum energy {df['Energy'][idx_min]:.2f} kcal/mol at a separation of {df['Distance'][idx_min]:.1f}Å"
)

view(results["Molecules"][idx_min], height=150, width=150)
Minimum energy -0.13 kcal/mol at a separation of 2.6Å
[09.04|17:55:53] Starting Xvfb...
[09.04|17:55:53] Xvfb started

See also
Python Script
#!/usr/bin/env python
# coding: utf-8

# ## Initial Imports

import numpy as np
import pandas as pd
from scm.base import ChemicalSystem, Bond, Units
from scm.plams import Settings, AMSJob, view


# ## Setup Dimer
#
# We first create intial system of two Helium atoms at some minimum separation.

d_min = 2.2
d_max = 4.2

he_dimer = ChemicalSystem()
he_dimer.add_atom("He", coords=[0.0, 0.0, 0.0])
he_dimer.add_atom("He", coords=[d_min, 0.0, 0.0])
he_dimer.bonds.add_bond(0, 1, Bond(1.0))
print(he_dimer)


# ## Calculation Settings
#
# We then set up the calculation settings. We will perform a PES scan over the He-He bond, taking 11 distances in our chosen range. For the engine we will use ADF with TZP/PBE+GrimmeD3.

settings = Settings()
settings.input.ams.task = "PESScan"
settings.input.ams.pesscan.scancoordinate.npoints = 11
settings.input.ams.pesscan.scancoordinate.distance = f"1 2 {d_min} {d_max}"
settings.input.adf.basis.type = "TZP"
settings.input.adf.xc.gga = "PBE"
settings.input.adf.xc.dispersion = "Grimme3"


# ## Create and Run PESScan Job
#
# The PES scan can now be run:

job = AMSJob(molecule=he_dimer, settings=settings)
job.run()


# ## Results
#
# Results can be easily extracted using the `get_pesscan_results` method. We plot the energy as a function of the bond length, and the geometries either various points along the curve.

import pandas as pd

results = job.results.get_pesscan_results()
df = pd.DataFrame({"Distance": results["RaveledPESCoords"][0], "Energy": results["PES"]})
df["Distance"] *= Units.conversion_factor("Bohr", "Angstrom")
df["Energy"] *= Units.conversion_factor("Hartree", "kcal/mol")
print(df)


import matplotlib.pyplot as plt

fig, ax = plt.subplots(figsize=(3, 3))
ax.plot(df["Distance"], df["Energy"], ".-")
ax.set_xlabel("He-He distance [Å]")
ax.set_ylabel("Energy [kcal/mol]")
ax
ax.figure.savefig("picture1.png")


idx_min = df["Energy"].idxmin()

print(f"Minimum energy {df['Energy'][idx_min]:.2f} kcal/mol at a separation of {df['Distance'][idx_min]:.1f}Å")

view(results["Molecules"][idx_min], height=150, width=150, picture_path="picture2.png")