PolTDDFT: damped complex polarizabilities Au12
In this Tutorial we calculate the absorption spectrum of Au12 using PolTDDFT, which is a fast algorithm to solve the TD-DFT equations. We will look at some of the analysis options that PolTDDFT has to offer, like the so called individual component maps of oscillatory strength (ICM-OS, see Ref. [1]), transition contribution maps (TCM), and an analysis of the spectra per region, using the fragment projection analysis approach (see Ref. [2]).
Note
See also the webinar by Mauro Stener regarding PolTDDFT
Set calculation options
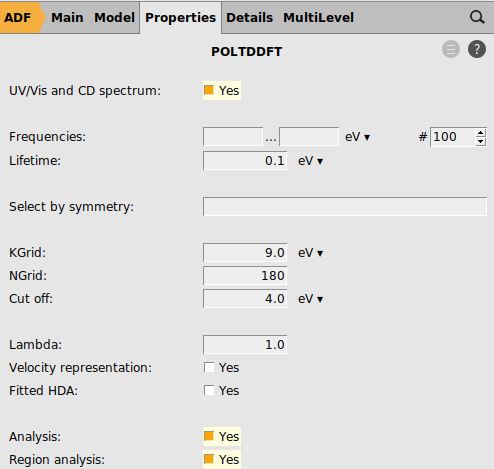
For PolTDDFT it very important is to use specially made auxiliary fit sets. Here we will use the POLTDDFT/DZ frozen core basis set for Au. The model exchange-correlation potential LB94 will be used, which is often used in PolTDDFT calculations. LB94 has an asymptotically correct Coulomb tail and is thus superior to purely gradient-corrected xc-functionals (such as PBE) in describing low-lying unoccupied electronic states.
In order to use the region analysis option we divide Au12 in 2 regions: the 3 inner gold atoms in one region and the other 9 in another region.
Au       3.90924307       1.34478417       0.00000000
Au       1.60055482       2.77224227       0.00000000
Au      -0.79000428       4.05789589       0.00000000
Au      -3.11923879       2.71311172       0.00000000
Au      -0.77594464       1.34397554       0.00000000
Au       1.55188928      -0.00000000       0.00000000
Au       3.90924307      -1.34478417       0.00000000
Au       1.60055482      -2.77224227       0.00000000
Au      -0.77594464      -1.34397554       0.00000000
Au      -3.20110964      -0.00000000       0.00000000
Au      -3.11923879      -2.71311172       0.00000000
Au      -0.79000428      -4.05789589       0.00000000
 button to add a region, and rename Region_1 to
 Au3Au9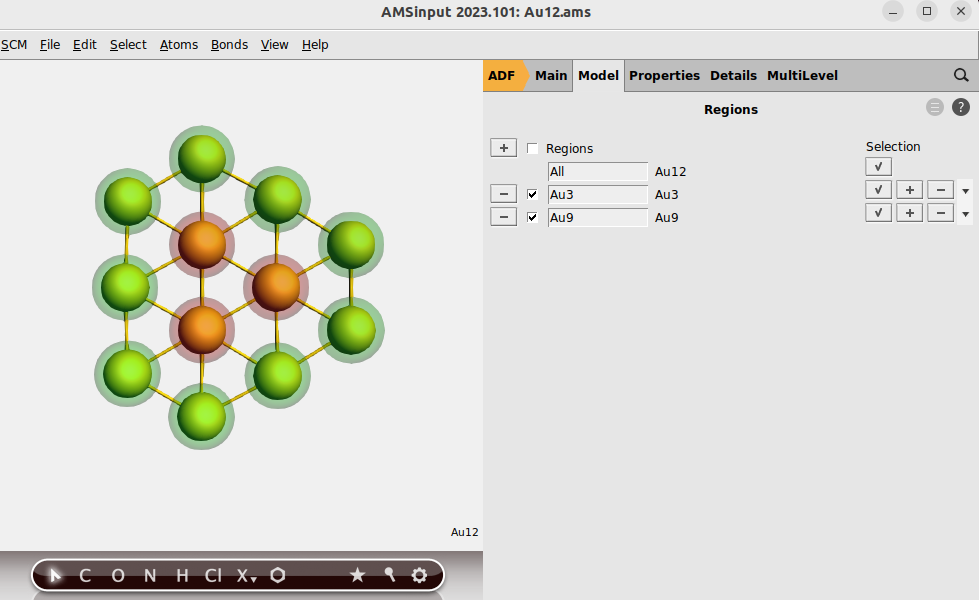
 panel
panel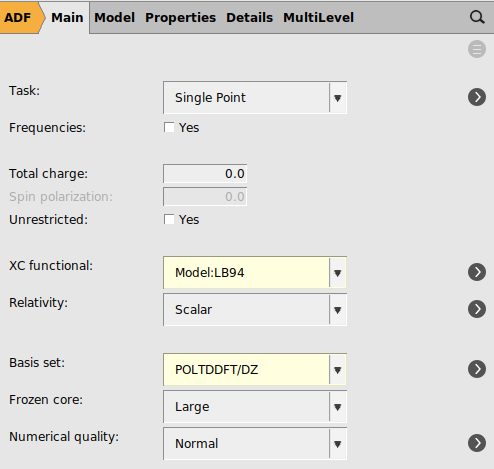
We are now ready to run the calculation.
Au12 using File → Save As….Results
Once the PolTDDFT calculation has finished, the absorption spectrum can be viewed.
 → Spectra
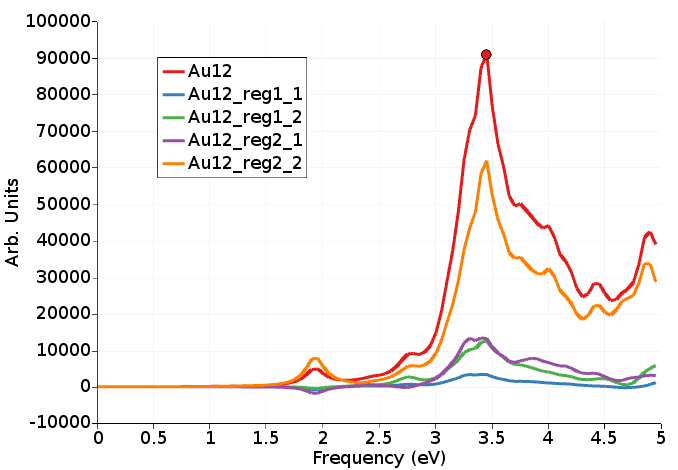
Here we see an analysis of the absorption spectrum per region, using the fragment projection analysis approach (see Ref. [2]).
The most important part comes from region Au9 -> region Au9 (orange, Au12_reg2_2), which is not unexpected because there are more atoms in region Au9 than in region Au3, but it is larger than expected (expected is around (9*9)/(12*12)=56%).
Right of the absorption spectrum one can find a two-dimensional ICM-OS plot for the X component. If one selects the highest peak (point 70 at 3.45 eV) in the absorption spectrum the ICM-OS plot for the X component at frequency 3.45 eV will be shown. Next one can select the TCM plot for the X component at frequency 3.45 eV. Of course, for a full analysis at a certain frequency one should also look at the Y and Z component. Here, due to symmetry, the Y component will give the same information as the X component. The contributions to the oscillator strength from the Z component are small.
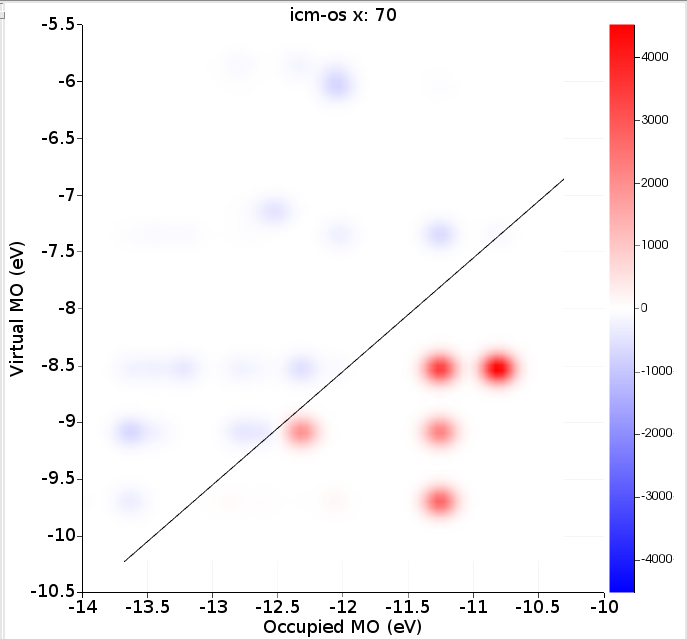
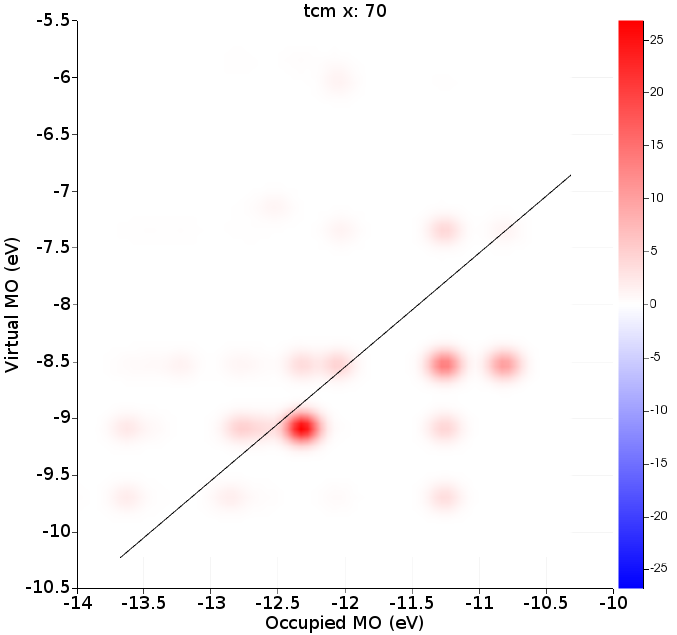
ICM-OS (Ref. [1]) allows one to analyze and better understand the features of electronic transitions. It allows one to decompose a specific absorption peak in terms of electronic single orbital transitions labeled by the energy of the occupied (x-axis) and virtual (y-axis) orbitals involved. The diagonal line shows where the excitation energy matches a difference in occupied and virtual energies. In addition to the weight of each pair of orbitals in the oscillator strength, ICM-OS also accounts for the signs of the associated dipole contributions, which may result in constructive (in red) or destructive (in blue) interference among excited configurations. TCM is more focused on a description of the excited state in terms of electronic single orbital transitions (with only positive contributions) than being suited to rationalize the mechanisms which are behind absorption.
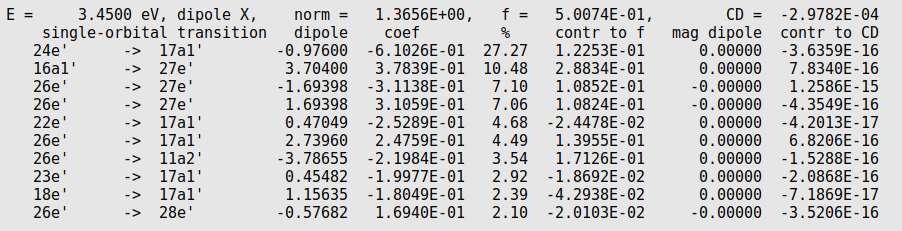
In the output one can find
%: the relative character of a single orbital transition (SOT), like the TCM plot is showing,
contr to f: how much this SOT character contributes to the oscillator strength, like the ICM-OS plot is showing.
To know the energy of an orbital it helps to open an AMSLevels window.
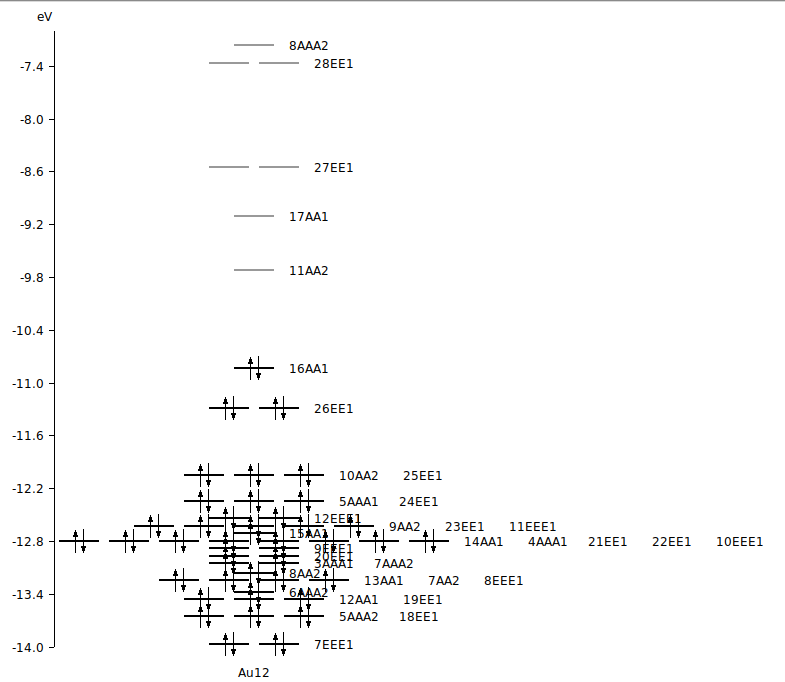
Note that irreps for D(3H) in ADF are sometimes written as AA1, AAA1, AA2 AAA2, EE1, and EEE1, they stand for A1’, A1’’, A2’, A2’’, E1’, and E1’’.
So the SOT 24e' -> 17a1' is from the orbital 24EE1 to the orbital 17AA1
One can imagine that for a larger gold cluster the number of SOTs that may be important at a certain frequency may grow rapidly. In that case the TCM plot and ICM-OS plot are easier to understand.