Lattice Optimization and Phonons
This tutorial will show you how to:
Perform a geometry optimization (including lattice vectors optimization) for a periodic system
Calculate and visualize the phonon dispersion curves
Set up the calculation
Let us begin by starting up the AMSinput GUI module:
 →
→ 
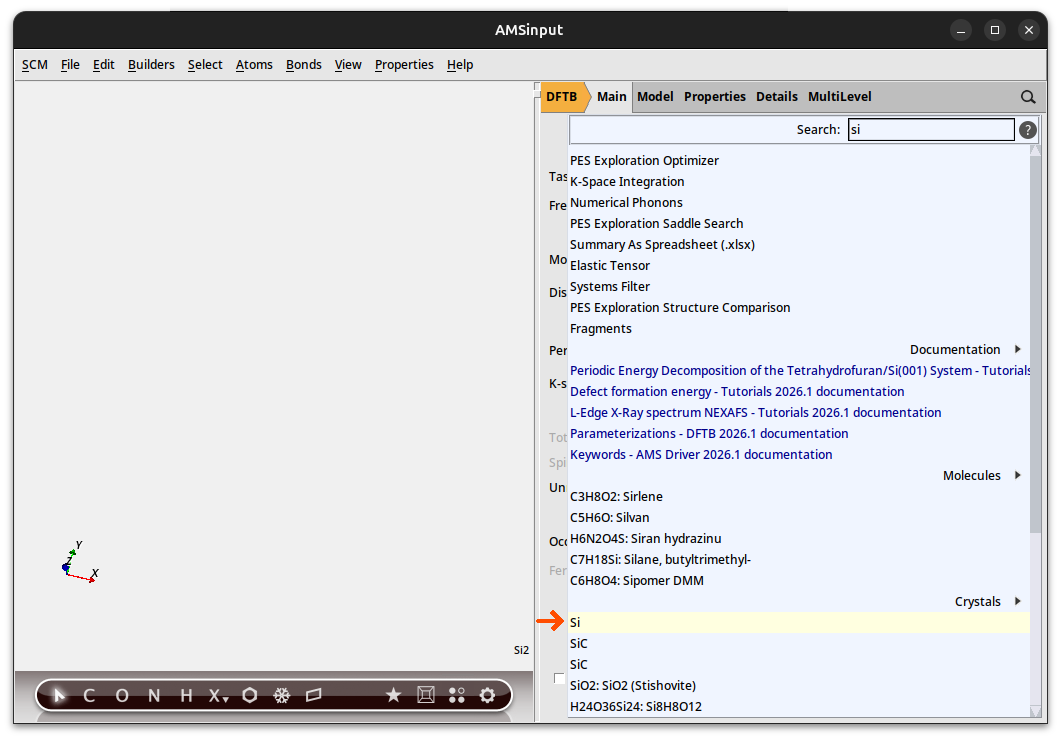
Now we will import the silicon structure from our database:

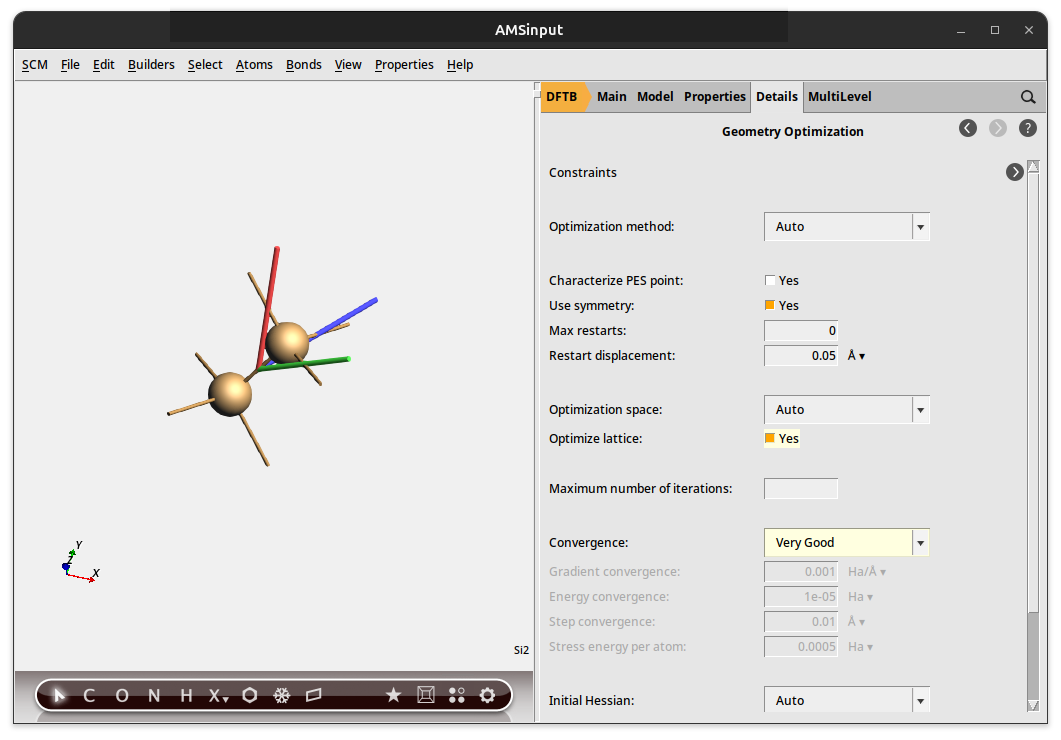
Phonons should be calculated on an optimized geometry. We therefore first need to perform a geometry optimization:
By default, only the internal degrees of freedom are optimized in a geometry optimization (i.e. the atomic positions within the unit cell are optimized, but the lattice vectors are not optimized). In order to obtain a proper phonon spectrum, one needs to optimize the lattice vectors as well as the internal degrees of freedom. When optimizing the geometry for a phonon calculation, we generally recommend using tight convergence thresholds for both the nuclear and lattice degrees of freedom.
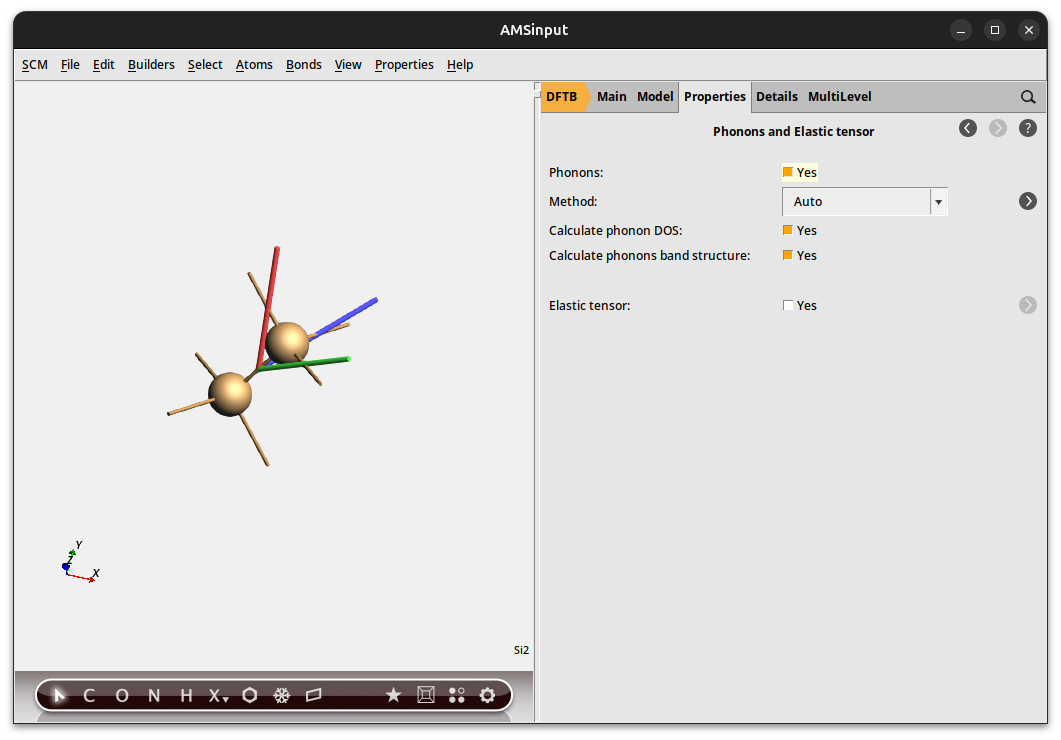
Finally we also need to specify that we want to calculate phonons at the end of the optimization.
Optionally, you can tweak the settings of the phonon calculation in the panel Details → Phonons. Using a larger super cell in Details → Phonons will result in more accurate phonon curves, but will also significantly increase the computation time.
We will now set a few options specific to DFTB.
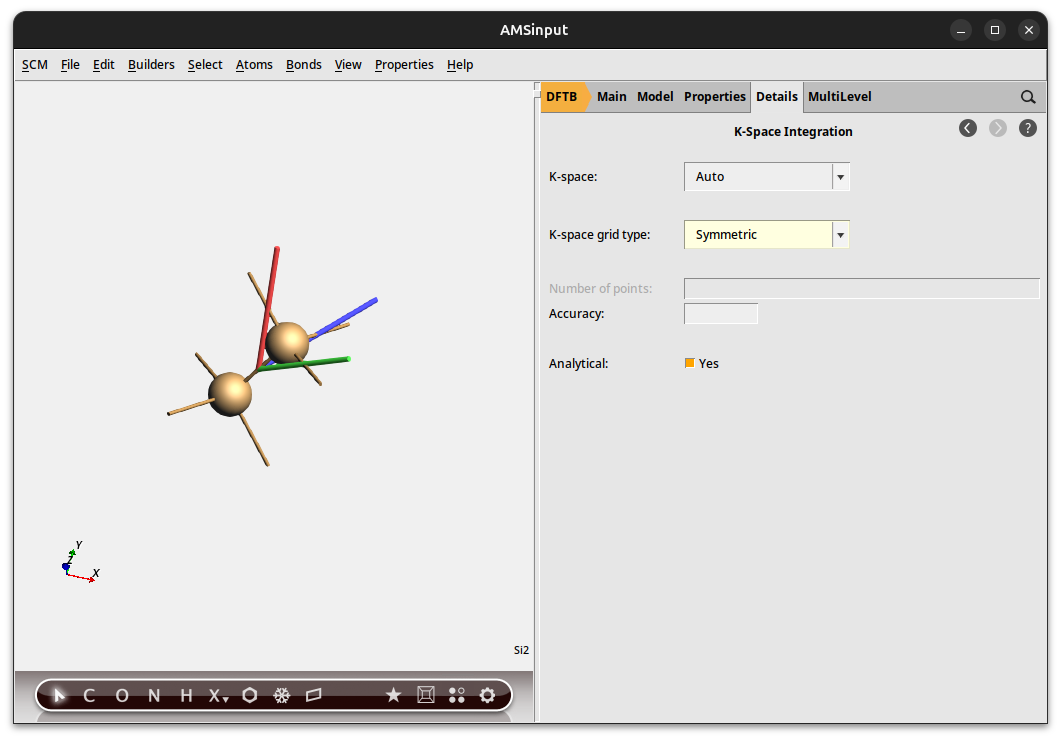
We explicitly ask for the symmetric k-space integration grid for our calculation of silicon, which is a highly symmetric system. For such a system the symmetric grid is more accurate and faster. However, unless your system is highly symmetric, we recommend using the default (regular) grid.
Run the calculation
We are now ready to run the calculation.
This will open AMSjobs and start the calculation. You can monitor the progress of your calculation by opening the log file:
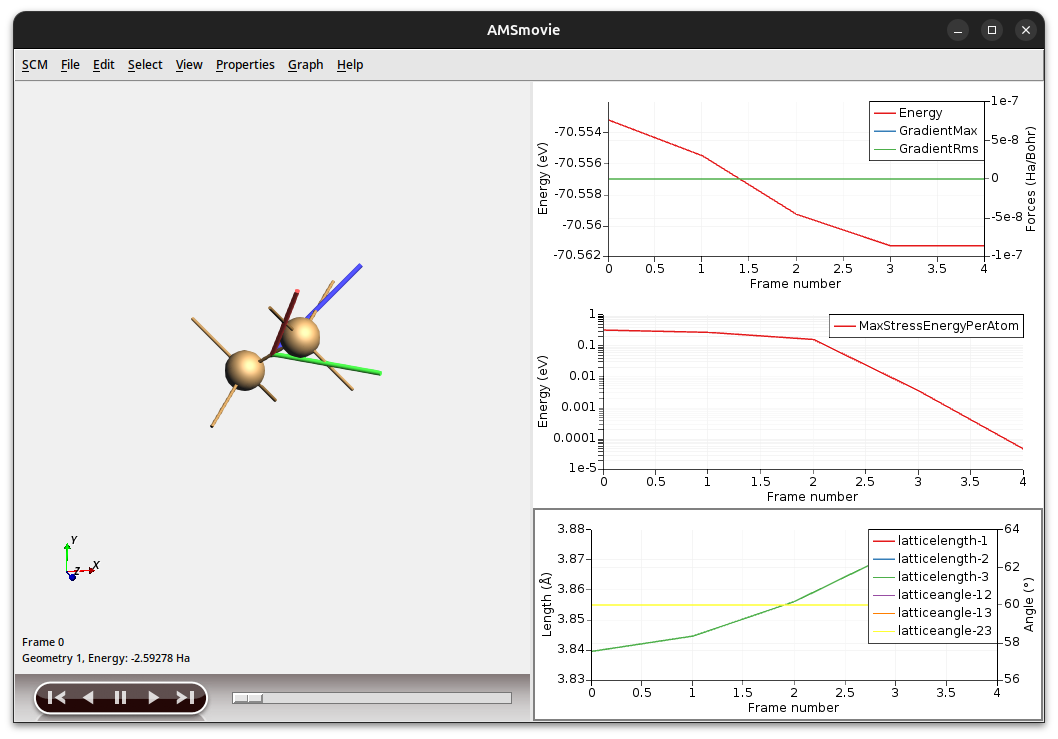
As you can see the high symmetry of the system is maintained: All angles between the lattice vectors are 60 degrees and all vectors keep the same length. However, the entire crystal has expanded ever so slightly. (The strict nuclear gradients convergence threshold we set earlier actually did not matter, as all the nuclear gradients disappear due to the symmetry of the system. We were therefore essentially only optimizing the lattice degrees of freedom.)
Visualize the Phonons
Once the calculation is completed, you can visualize the phonon dispersion curves:
This will open the AMSbandstructure visualization program:
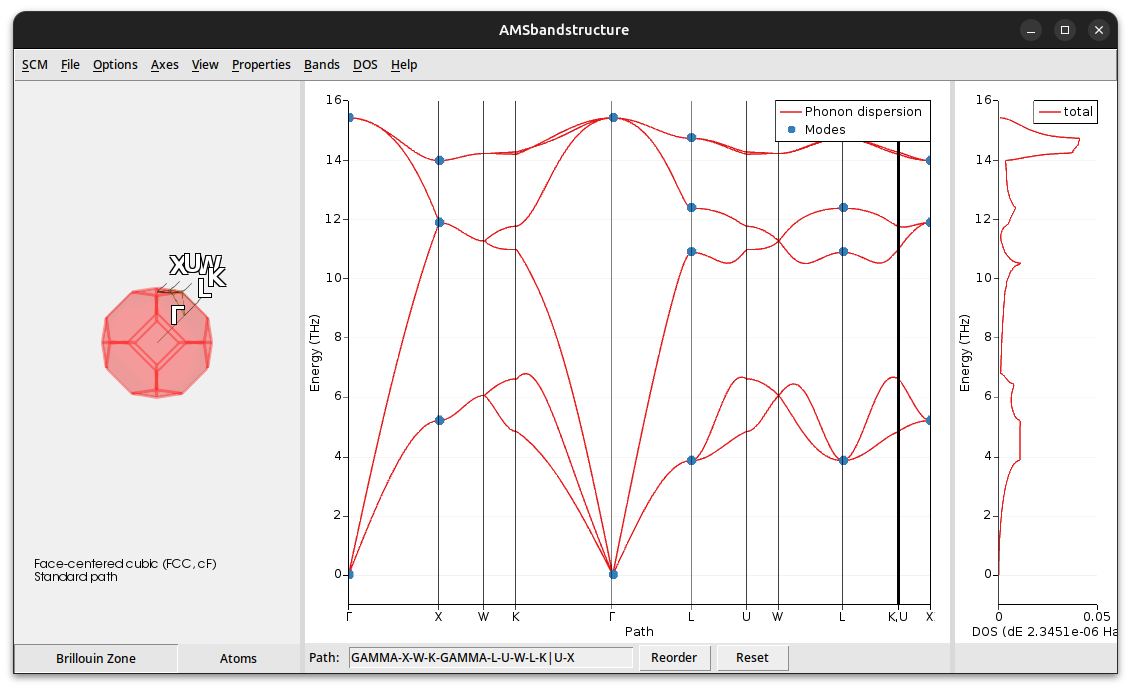
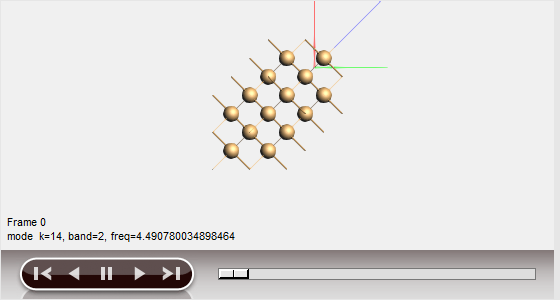
You can visualize the motion of the atoms for certain modes (marked by a blue dot in the dispersion curves):
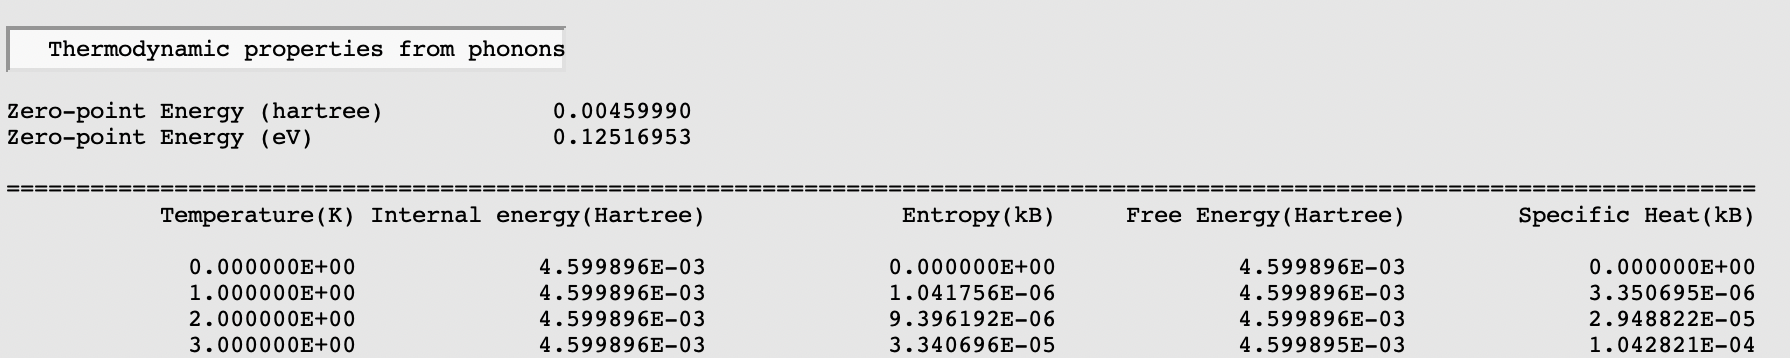
Thermodynamic properties derived from the phonon calculation are printed to the output file. To open the output file: