Toluene charges, movies, frequencies and normal modes
The MOPAC-GUI is basically the same set of programs as the ADF-GUI. We suggest you start with the more general GUI tutorials if you are not familiar with the ADF-GUI.
When saving a job and running, MOPAC will be executed. The MOPAC results (output and AUX file) will be converted to a .rkf result file, that allows visualization of the results with the GUI modules like ADFview, ADFmovie and ADFspectra. Results that may be visualized include geometry, optimization changes (with energy), charges, bond orders, frequencies and normal modes. Obviously the MOPAC output file is also available
This tutorial will give you an example how to use MOPAC via the MOPAC-GUI from SCM.
Set up Toluene in MOPACinput
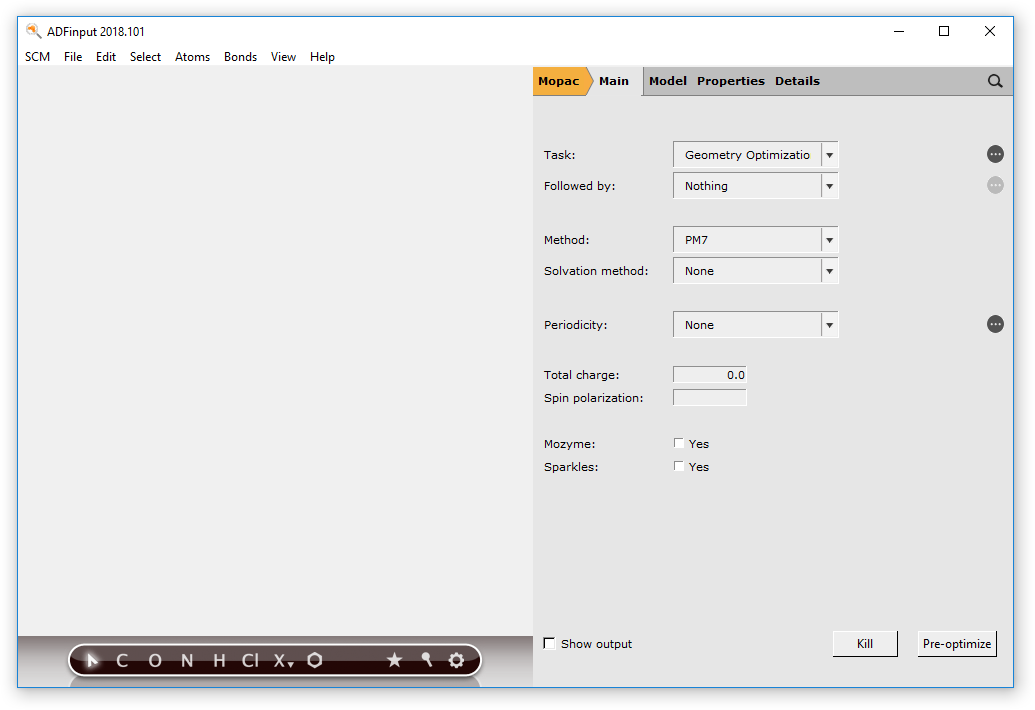
- Start ADFjobsSCM → New InputSwitch to MOPAC mode (panel bar ADF → Mopac)
We will now make a Toluene molecule. Most conveniently this is done by simply searching for it within the MOPAC-GUI:
- Control/Command-FEnter ‘toluene’ as search textSelect ‘Toluen’ (the second match) from the list of matchesClick once in the drawing area in empty space to clear the selection

Run interactively
In the Mopac Main panel you can see what options for MOPAC have been selected: by default a Geometry optimization will be performed, using the PM7 method. MOPAC will also calculate the bond orders, and the GUI will automatically update the molecular bonds using these calculated bond orders. To show this, we will first remove the bonds and then run MOPAC by pressing the Run button:
- Bonds → Remove BondsPress the ‘Pre-optimize’ button
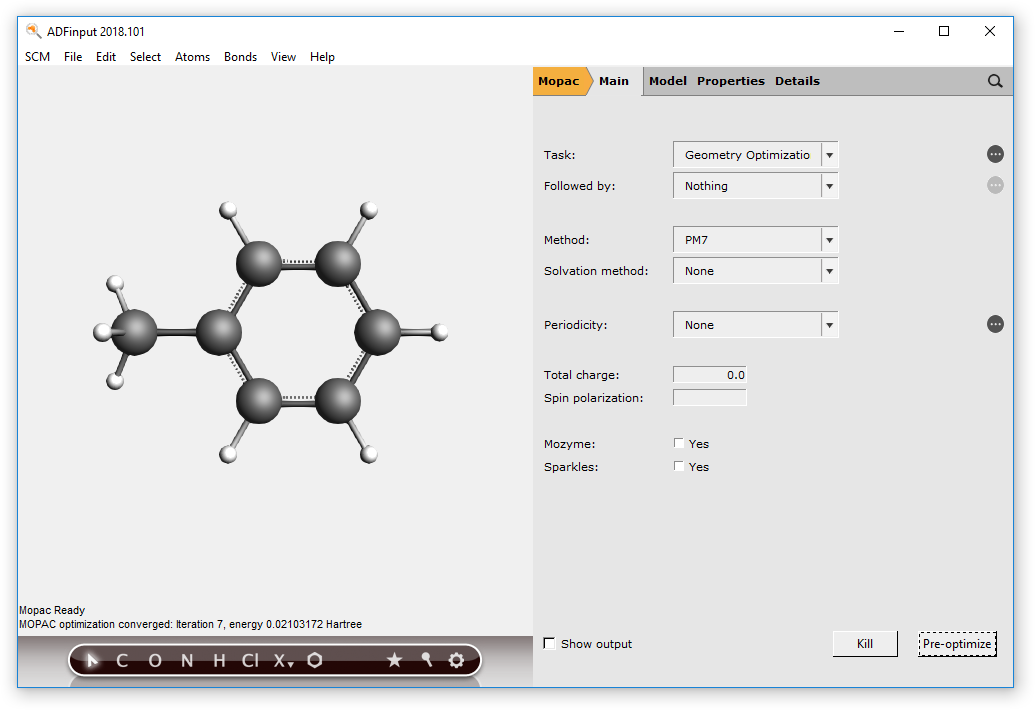
The geometry has been optimized, but as the starting geometry was very reasonable this did not lead to big changes. In the status area you can see the status of the MOPAC pre-optimization and the final heat of formation. And obviously the bonds reappeared. These bonds are actually based on the bond orders as calculated by MOPAC.
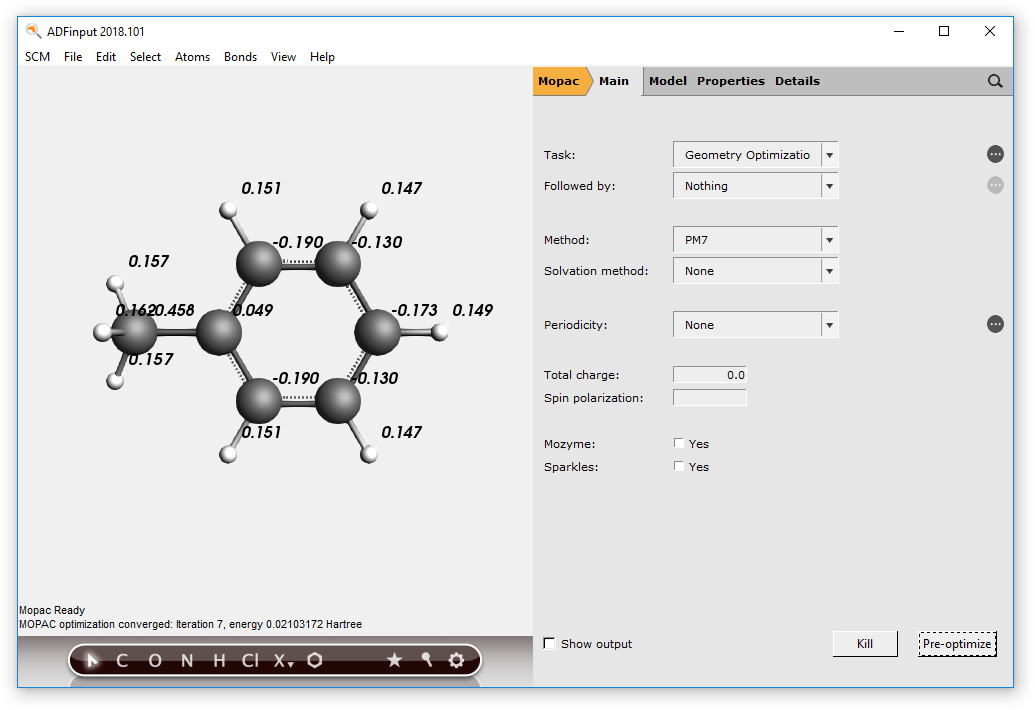
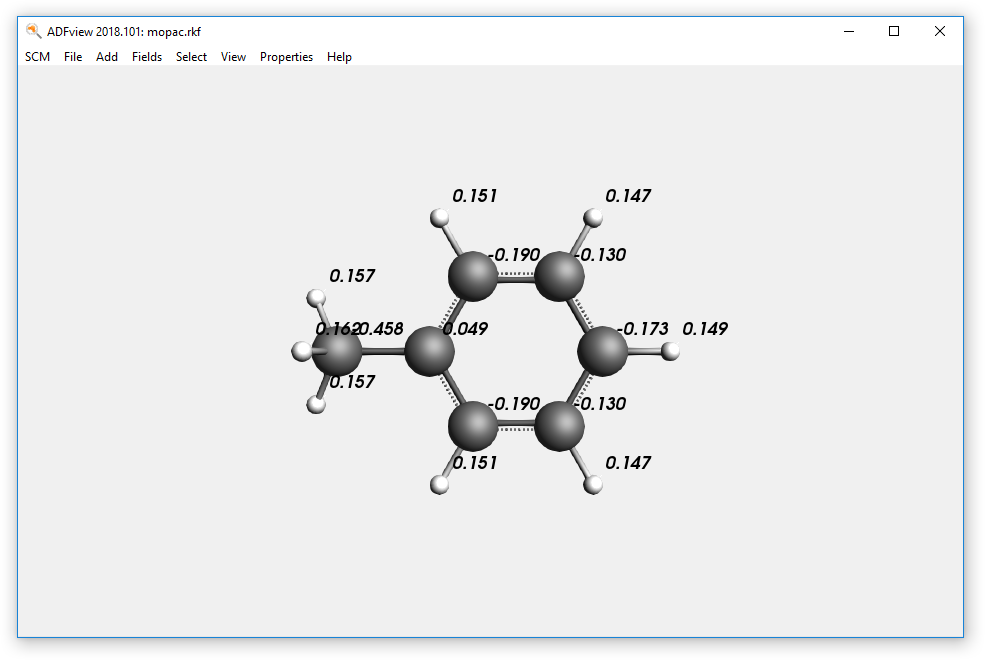
You can now also show the calculated atomic charges:
- View → Atom Info → Atomic: Charge (mopac) → Show
To see the MOPAC output, check the ‘Show output’ check box. And there is another way to run MOPAC interactively: use the pre-optimizer button (the cog wheel).
- Check the ‘Show output’ check boxRight-click on the cog-wheel (the pre-optimizer button), and select Mopac from the menu
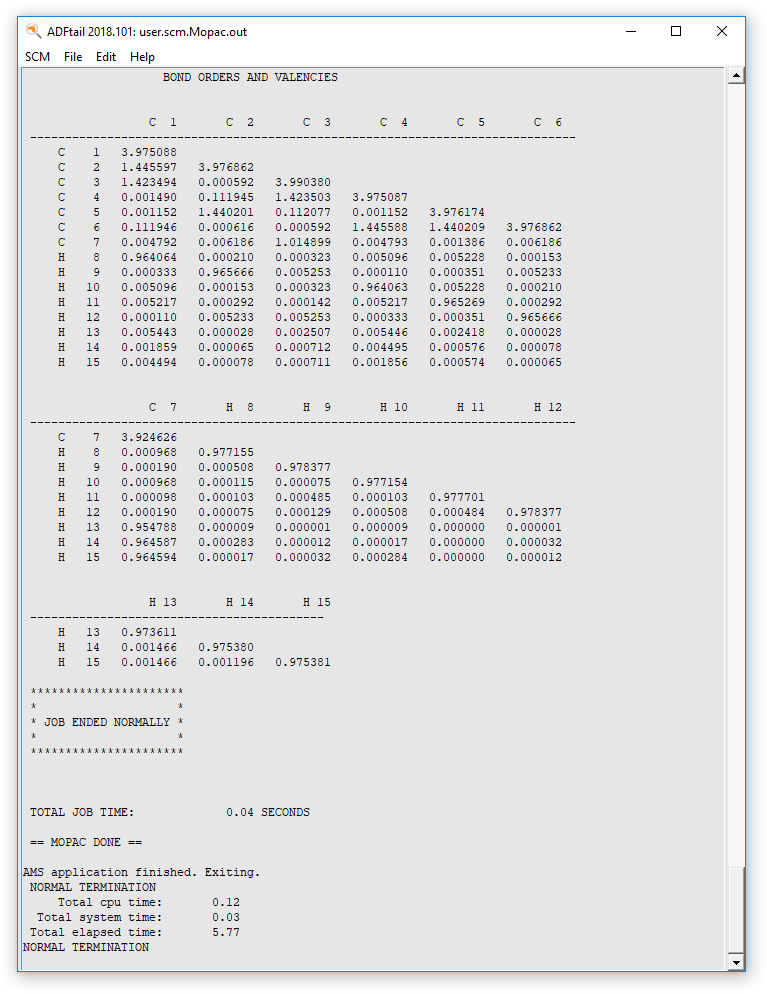
As the geometry already had been optimized, nothing much happens. Except the MOPAC output file will be opened and appear in a new window. This file actually starts with the AUX file, followed by the output file.
- Close all windows except ADFjobs (no need to save your setup)
Save job and results: charges, movies, IR spectrum and normal modes
The previous section showed how to run MOPAC interactively, typically to be used as a pre-optimizer. However, you can also run the MOPAC calculation as a ‘real’ job. Then the result files will be saved, and you can analyze them with the GUI tools.
- SCM → New InputPanel bar ADF → MopacControl/Command-FEnter ‘toluene’ as search textSelect ‘Toluen’ (the second match) from the list of matchesClick once in the drawing area in empty space to clear the selection
Once again we have our Toluene molecule. We now request the calcualtion IR spectrum and normal modes:
- In the main panel, select Followed by → Frequencies
Now to run it as a job simply use the Save and Run command from the menu:
- File → Save, save the job with name ‘Toluene’File → Run
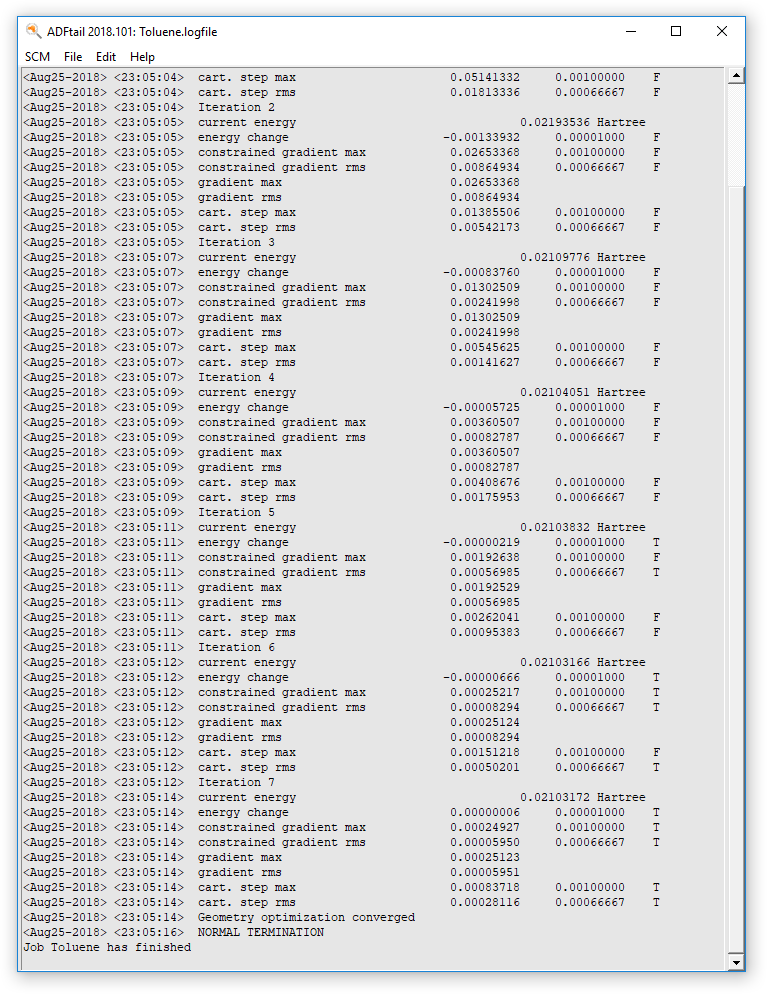
- When asked to read the new coordinates (when the calculation finishes), click YesSCM → Logfile
The logfile will show the progress of the calculation:
- SCM → ViewProperties → Atom Info → Atomic: Charge (mopac) → Show
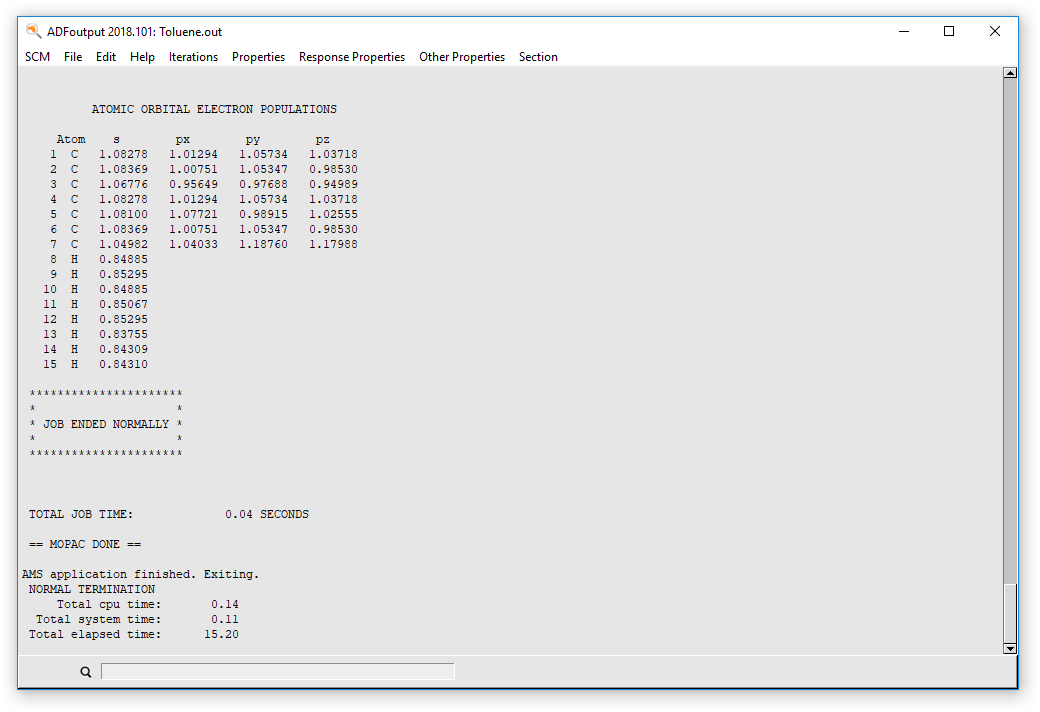
The Mopac output is also available:
- Close the ADFview windowSCM → OutputScroll to the end
Now for a geometry optimization it might be interesting to see a movie of the progress of the optimization:
- Close the ADFoutput windowSCM → MovieGraph → Energy
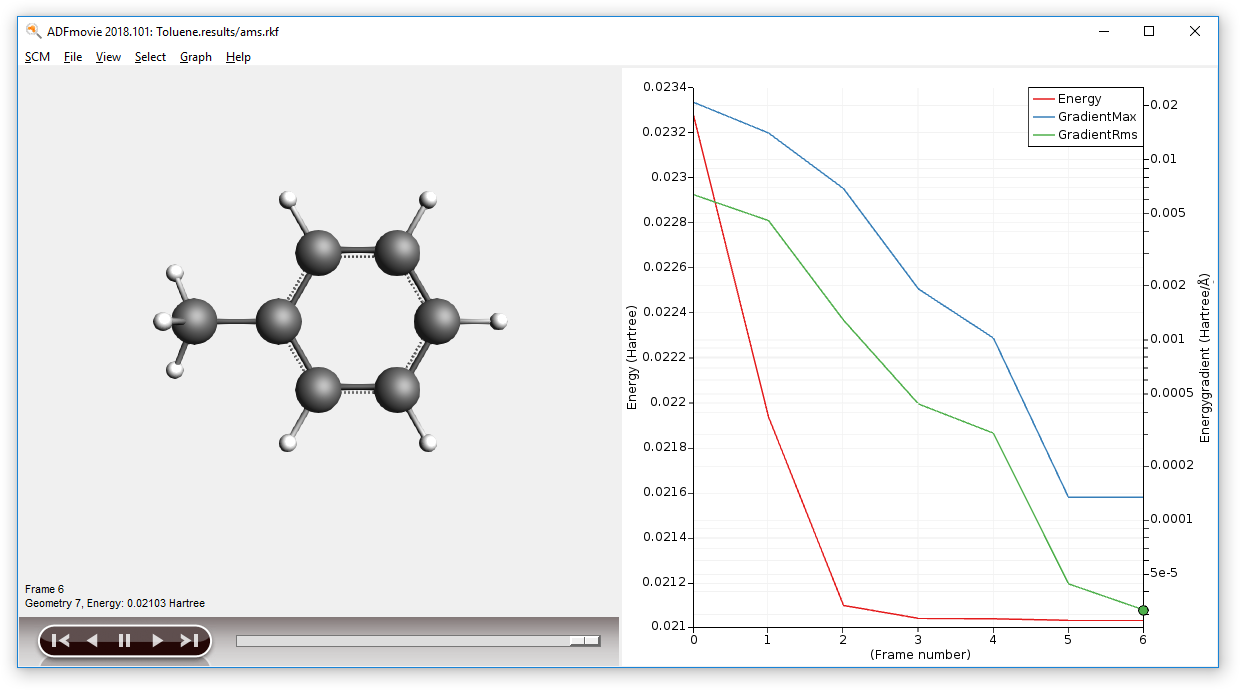
You can also use ADFmovie to get detailed information about the geometry (distances, angles and so on), just as for an ADF geometry optimization. If you don’t know how, check the more general GUI tutorials.
The calculated IR spectrum can be visualized via ADFSpectra:
- SCM → Spectra
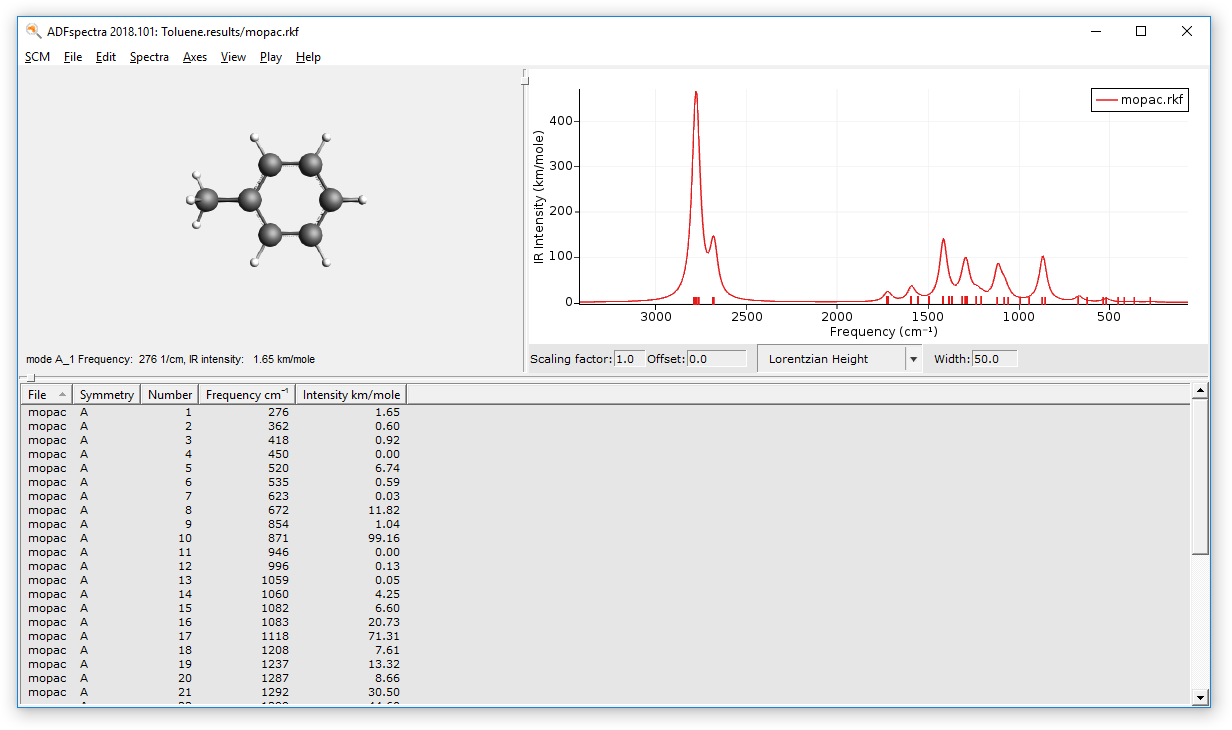
- Click on the peak with the highest intensity, which is found around 2766 cm-1.
The selected mode will be shown:
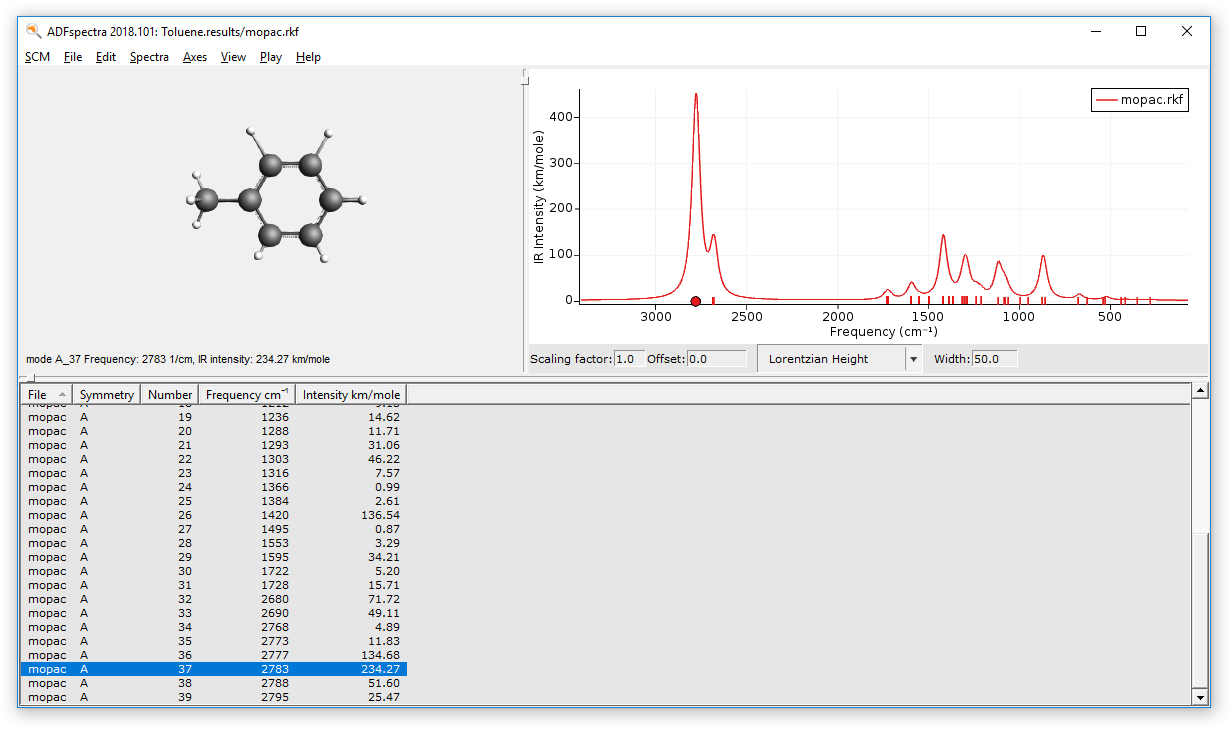
- Browse through the normal modes using the left and right arrow keyTry the alternative method:Click on the normal mode of interest in the tableSCM → Quit All