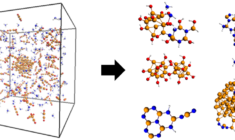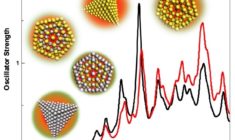
Fast & efficient plasmonic excitations in metallic nanoparticles
Key concepts: ADF, DFTB, nanoscience, plasmon, spectroscopy, TDDFT, UV/VIS
Advance your chemistry, materials science, and engineering research with the Amsterdam Modeling Suite.
Easy to employ yet powerful computational chemistry tools, with support from our experts.
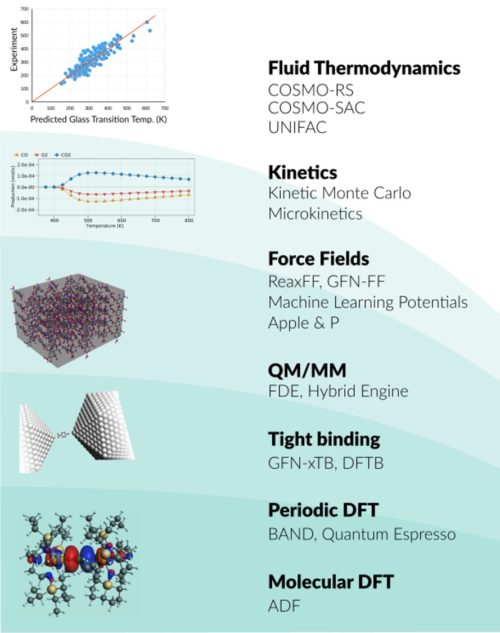
Whether you research spectroscopic properties, chemical processes, or advanced materials, we have the right tools for you. The Amsterdam Modeling Suite (AMS) provides a comprehensive set of modules for computational chemistry and materials science, from quantum mechanics to fluid thermodynamics.
Try the complete Amsterdam Modeling Suite for 30 days for free. Enjoy expert technical support from our developers, also during your evaluation. Discover how the whole suite helps to advance your research, or just license the modules you need most.
Try AMS yourself
Learn more |
A powerful density functional theory program for molecules, particularly strong in spectroscopy and inorganic chemistry. ADF Tutorials • Recent Applications |
Learn more |
A very accurate periodic density functional theory program for condensed matter, including bulk, surfaces, and nanowires. BAND Tutorials • Recent Applications |
Learn more |
Density Functional Tight Binding: fast approximate DFT for molecules, 1D, 2D, and 3D. DFTB module also includes fast semi-empirical MOPAC engine, also with any periodicity. DFTB Tutorials • Recent Applications |
Learn more |
Machine Learning Potential backend for PES tasks. ANI-1cxx and ANI-2x potentials. Includes ForceField (GFN-FF, Apple&P, GAFF) MLPotential Tutorial • Apple&P Tutorial |
Learn more |
Reactive force field for large-scale molecular dynamics simulations with chemical reactions. Many ReaxFF force fields and analysis tools. ReaxFF Tutorials • Recent Applications |
Learn more |
Instant fluid thermodynamics from quantum mechanics and property predictions from group contributions. Includes COSMO-SAC and UNIFAC. COSMO-RS Tutorials • Recent Applications |
Learn more |
ParAMS for Parametrizing ReaxFF, DFTB, and ML Potentials is part of Advanced Workflows including tools for OLED material properties, kinetics, and reaction mapping. ParAMS Tutorials • OLED Workflows • Kinetics |
Any license containing one of SCM’s own modules above will automatically include the Amsterdam Modeling Suite Core: the graphical user interface, the PLAMS python scripting environment, and the central AMS driver for complex tasks on the Potential Energy Surface. It also includes some basic force fields, builder, and analysis tools.
| Module | Core | Advanced Workflows | ML Potential & Force Field |
| Basic MD analysis | V | ||
| GUIs | V | ||
| PLAMS | V | ||
| AMS Driver | V | ||
| UFF, UFF4MOF, Sybyl, AMBER95 | V | ||
| Hybrid: QM/MM + other multi-layer | V | ||
| Autografs MOF builder | V | ||
| AMSConformers | V | ||
| ParAMS | V | ||
| Microkinetics | V | ||
| Interface to Zacros | V | ||
| OLED tools: deposition, HDF5, database | V | ||
| ACE-Reaction, Reactmap | V | ||
| ChemTraYzer | V | ||
| GFN-FF | V | ||
| GAFF | V | ||
| MLPotentials: ANI-2x, ANI-1ccx, M3GNet-UP | V | ||
| ML backends: PiNN, SchNetPack, sGDML, TorchANI | V | ||
| APPLE&P (without parameters) | V |
Additional functionality is licensed by third parties: NBO, Zacros, Apple&P parameters. Contact us for a quote (sales@scm.com).
The Amsterdam Modeling Suite is used by researchers in companies, government labs, and universities in many applications, including catalysis, polymers, batteries, and organic electronics.
Unsure about which modules may be appropriate for your research? Discuss your research question with us, or explore consulting options.
The powerful AMS Driver is integrated with ADF, BAND, DFTB, MOPAC, ML Potential & Force Field, and ReaxFF modules.
It helps you explore the potential energy surface of your system for molecules as well as periodic systems, for example through
All features (tasks and properties) can be applied to external programs as well.
Researchers can perform a larger variety of multi-layer calculations for molecules as well as for periodic systems with the hybrid engine. Any quantum mechanics and force field-based methods can be combined in any number of layers with mechanical embedding through a subtractive scheme. Electrostatic embedding through additive QM/MM is available for 2-layer systems with ADF, BAND or DFTB as the quantum mechanical region.
For high-throughput screening and workflows, we recommend the python library for automated molecular simulations, which is easily used with the entire Amsterdam Modeling Suite.
The new ParAMS program lets you easily build training sets, and parametrize ReaxFF and DFTB with a helpful graphical user interface.
Check out the webinar to see how easy it is to (re)parametrize RaaxFF (slides)! ParAMS is part of the Advanced workflows & tools module.
The graphical user interface supports setting up, running, and visualizing results for the open-source periodic density functional theory code Quantum ESPRESSO (see tutorials), which uses plane-wave basis sets and pseudopotentials. The interface to Quantum ESPRESSO and the 7.0 binaries are provided at no extra charge.
Simple support is provided for the commercial VASP code. You need to provide your own binary and VASP license.
Key concepts: ADF, DFTB, nanoscience, plasmon, spectroscopy, TDDFT, UV/VIS
Key concepts: BAND, catalysis, oil & gas, Reactivity