Diamond Lattice Optimization and Phonons
This tutorial will show you how to:
- Perform a geometry optimization (including lattice vectors optimization) for a periodic system
- Calculate and visualize the phonon dispersion curves
More informations on these features can be found in the AMS User manual:
Set up the calculation
Let us begin by starting up the ADFInput GUI module:
- 1. Start ADFjobs2. Click on SCM → New Input. This will open ADFInput3. In ADFInput, select the DFTB panel:
 →
→ 
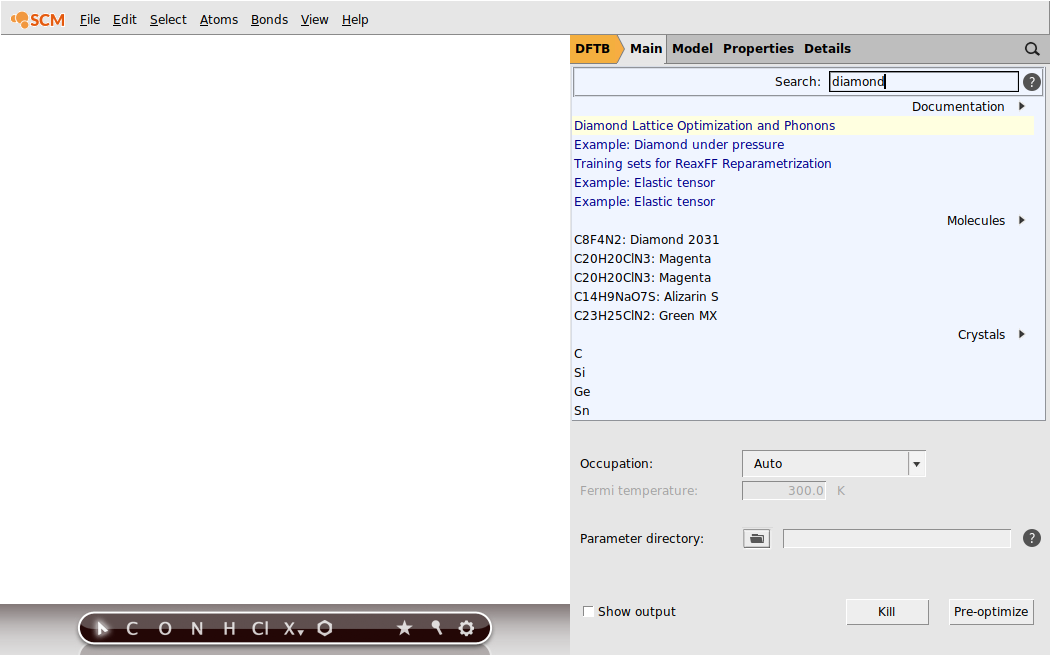
Now we will import the diamond structure from our database:
- 1. Search for Diamond in the search box
 2. Select Crystals → C
Phonons should be calculated for the optimal geometry. We therefore first need to perform a geometry optimization:
- In the Main panel1. Select Task → Geometry Optimization
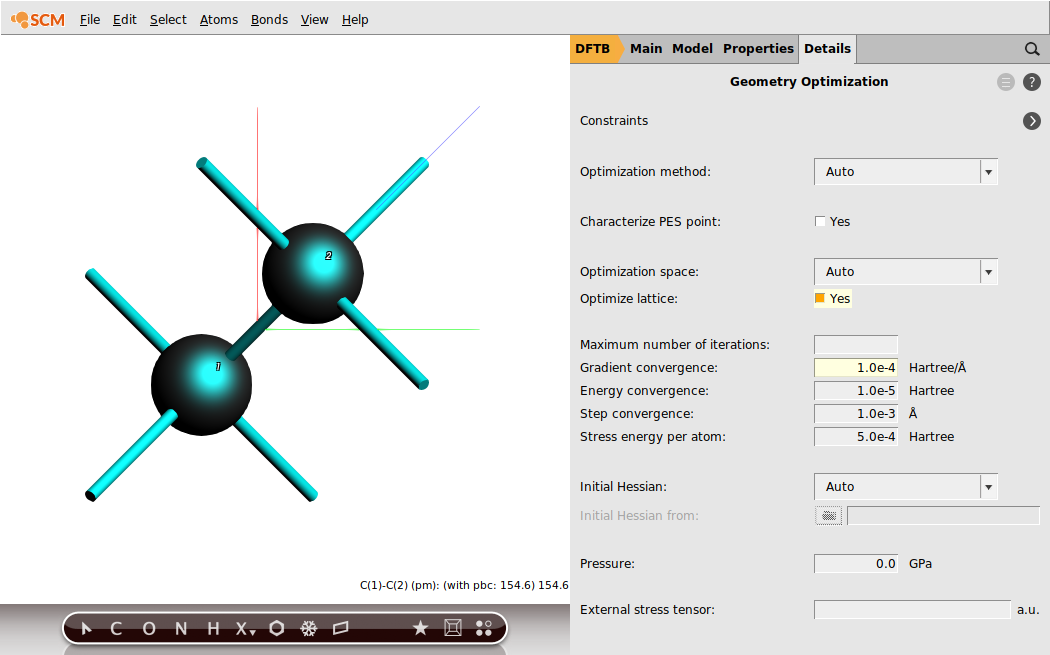
By default, only the internal degrees of freedom are optimized in a geometry optimization (i.e. the atomic positions within the unit cell are optimized, but the lattice vectors are not optimized). In order to obtain a proper phonon spectrum, one needs to optimize the lattice vectors as well as the internal degrees of freedom. When optimizing the geometry for a phonon calculation, we generally recommend using a strict Gradient Convergence threshold, e.g. 1.0e-4 Hartree/Angstrom.
- 1. Click on Details → Geometry Optimization2. Tick the Optimize Lattice check-box3. Set the Gradient Convergence threshold to 1.0e-4 Hartree/Angstrom
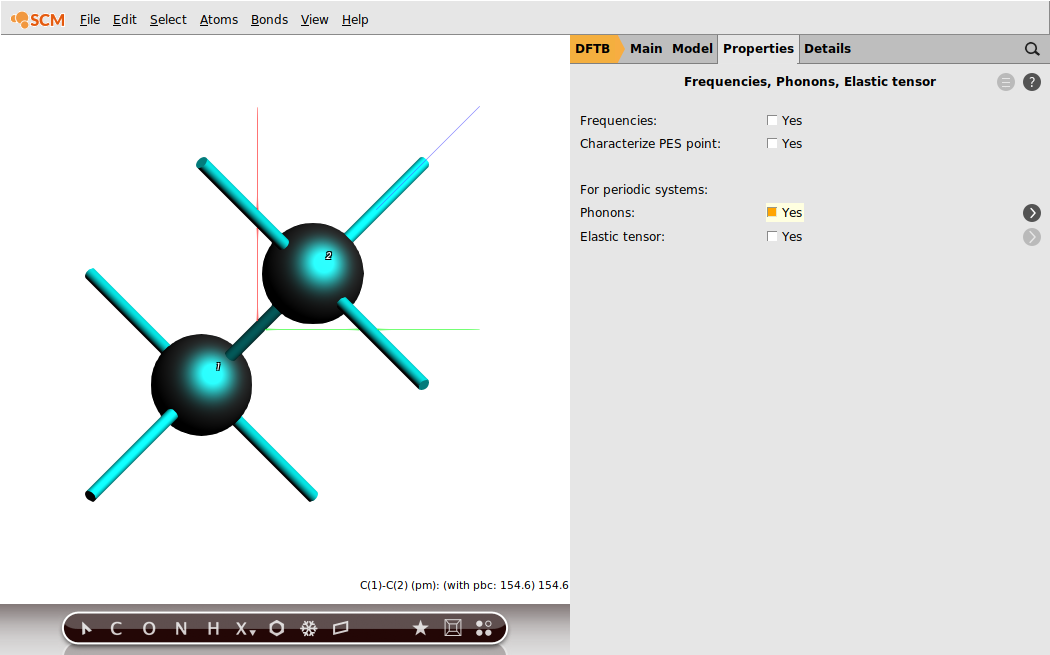
Finally we also need to specify that we want to calculate phonons at the end of the optimization.
- 1. Switch to the Properties → Frequencies, Phonons, Elastic tensor panel2. Tick the Phonons check-box
Optionally, you can tweak the settings of the phonon calculation in the panel Details → Phonons. Using a larger super cell in Details → Phonons will result in more accurate phonon curves, but will also significantly increase the computation time.
We will now set a few options specific to DFTB.
- 1. Go to the Main panel2. Select Parameter Directory → DFTB.org/mio-1-13. Go to the Details → K-Space Integration panel4. Set K-space grid type to Symmetric
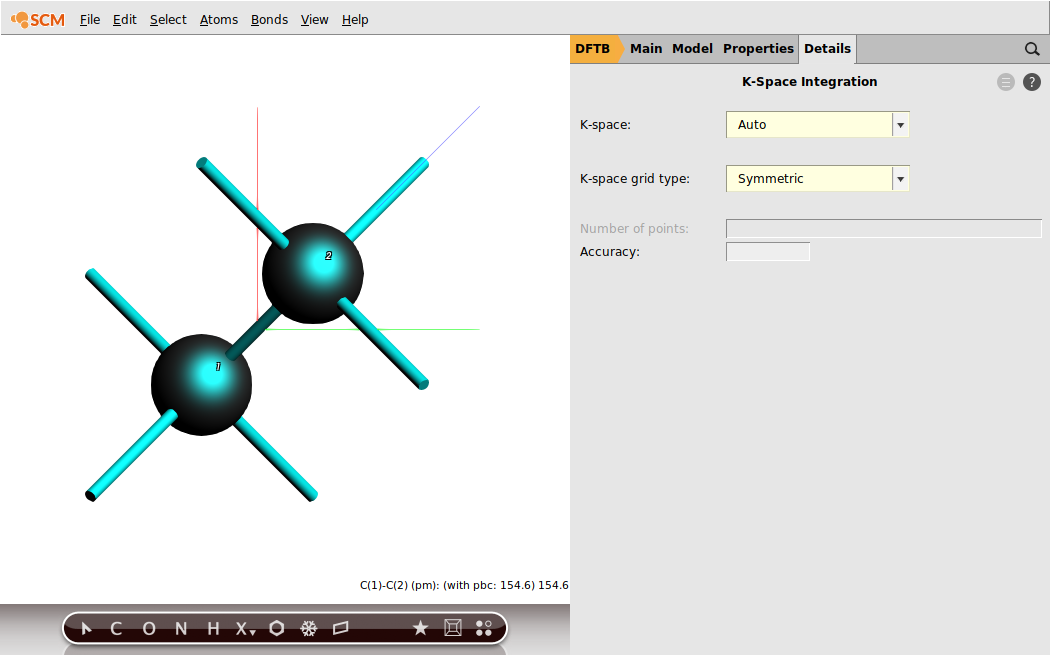
We explicitly ask for the symmetric k-space integration grid for our calculation of diamond, which is a highly symmetric system. For such a system the symmetric grid is more accurate and faster. However, unless your system is highly symmetric, we recommend using the default (regular) grid.
Run the calculation
We are now ready to run the calculation.
- 1. Click on File → Save and name it “diamond_phonons”2. Click on File → Run
This will open ADFjobs and start the calculation. You can monitor the progress of your calculation by opening the log file:
- In ADFJobs:1. Right-click on your job and select logfile to see the log file2. Right-click on your job and select ADFMovie to monitor the progress of the geometry optimization3. Click on Graph → Lattice Vectors to monitor also the lattice optimization3. Wait for the calculation to finish …
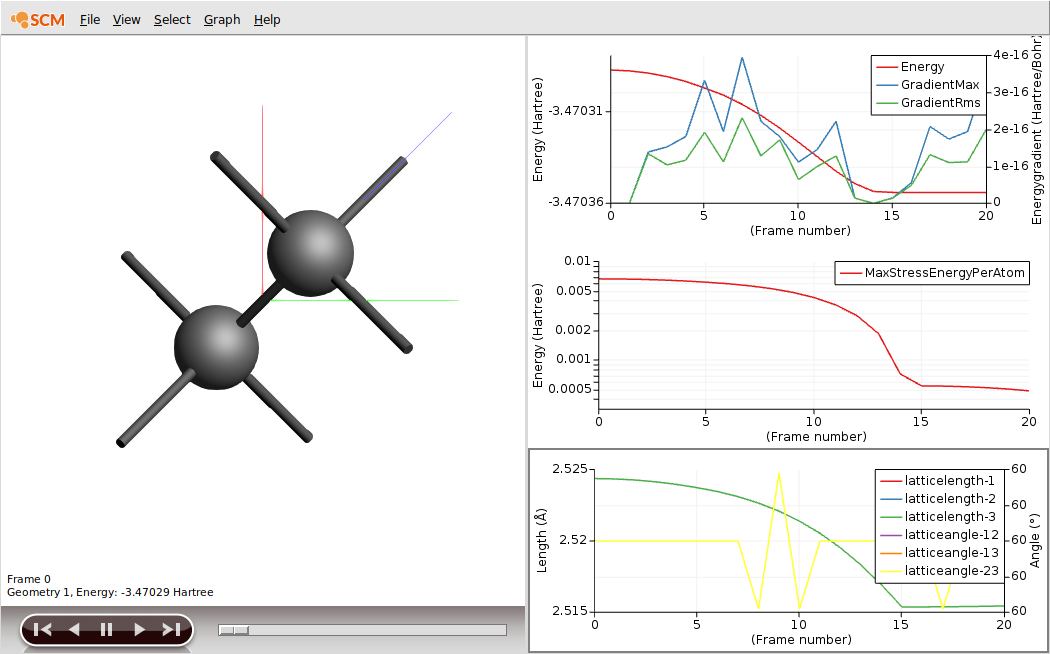
As you can see the high symmetry of the system is maintained: All angles between the lattice vectors are 60 degrees and all vectors keep the same length. However, the entire crystal has shrunk ever so slightly. (The strict gradients convergence threshold we set earlier actually did not matter, as all the nuclear gradients disappear due to the symmetry of the system. We were therefore essentially only optimizing the lattice degrees of freedom.)
Visualize the Phonons
Once the calculation is completed, you can visualize the phonon dispersion curves:
- In ADFJobs, right-click on your job and select BandStructure
This will open the BandStructure visualization program:
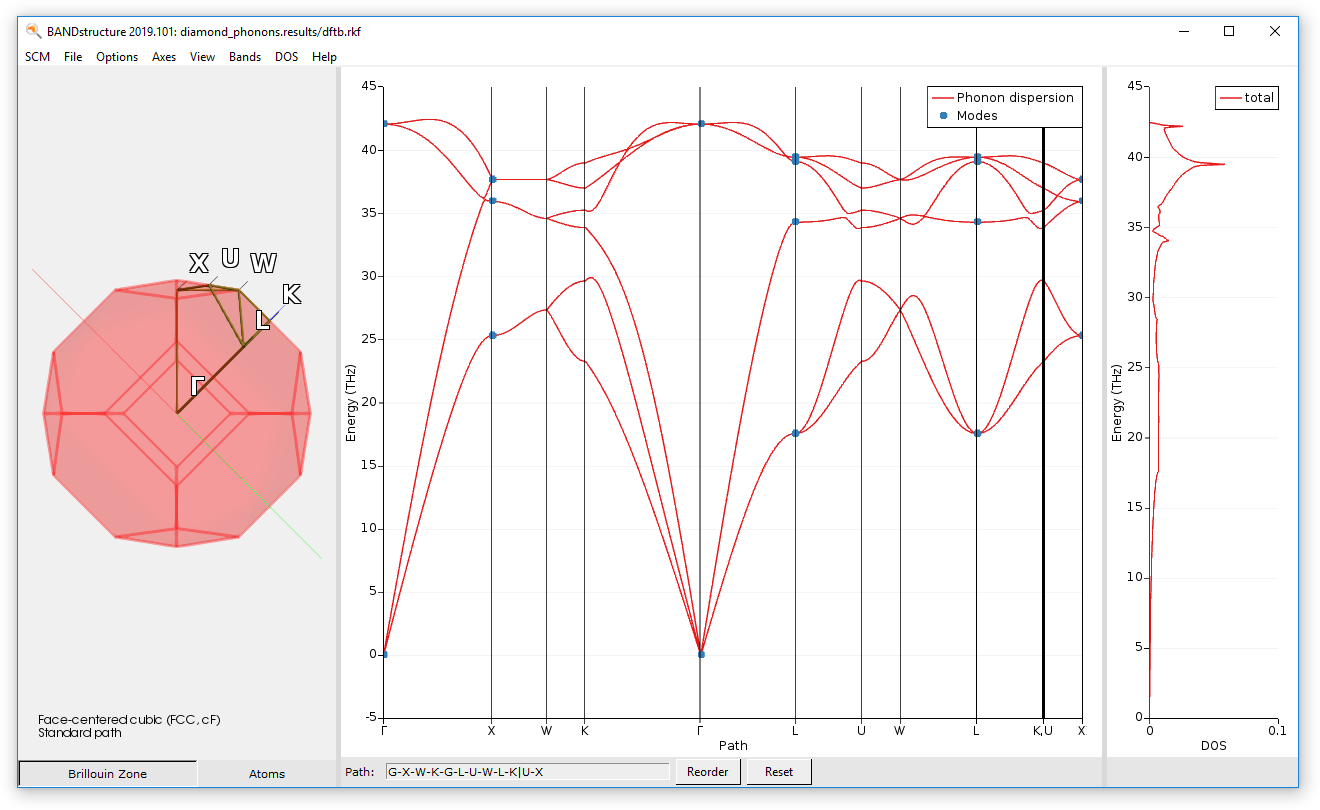
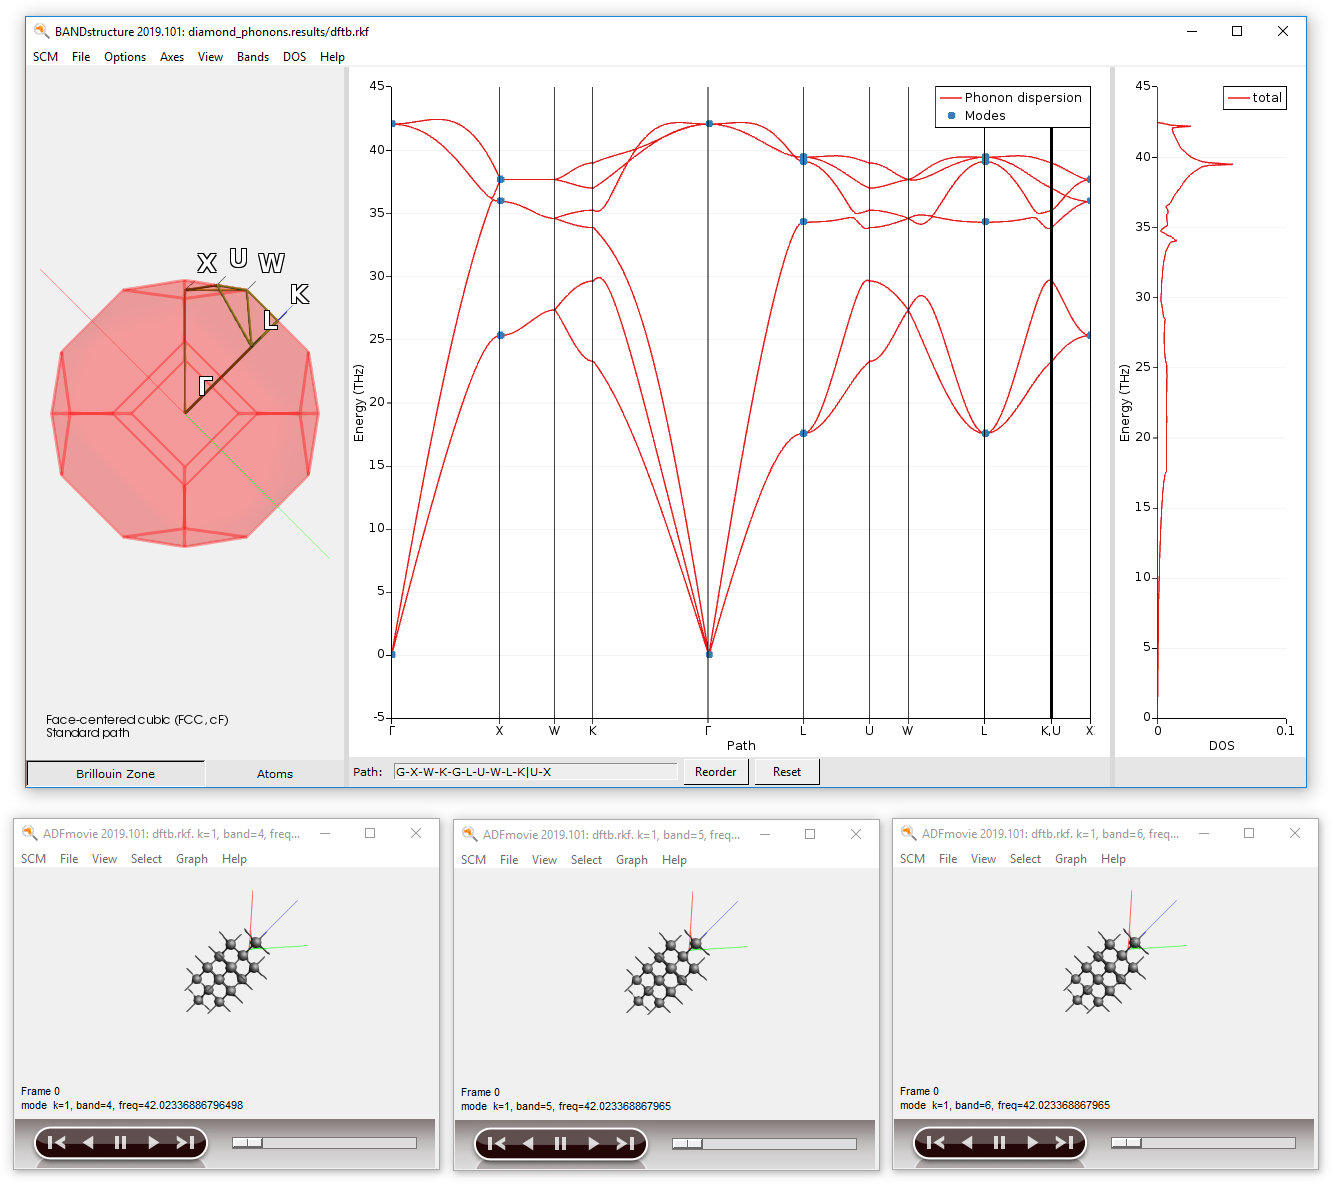
You can visualize the motion of the atoms for certain modes (marked by a blue dot in the dispersion curves):
- Click on one of the “Modes” dots in the phonon dispersion curves
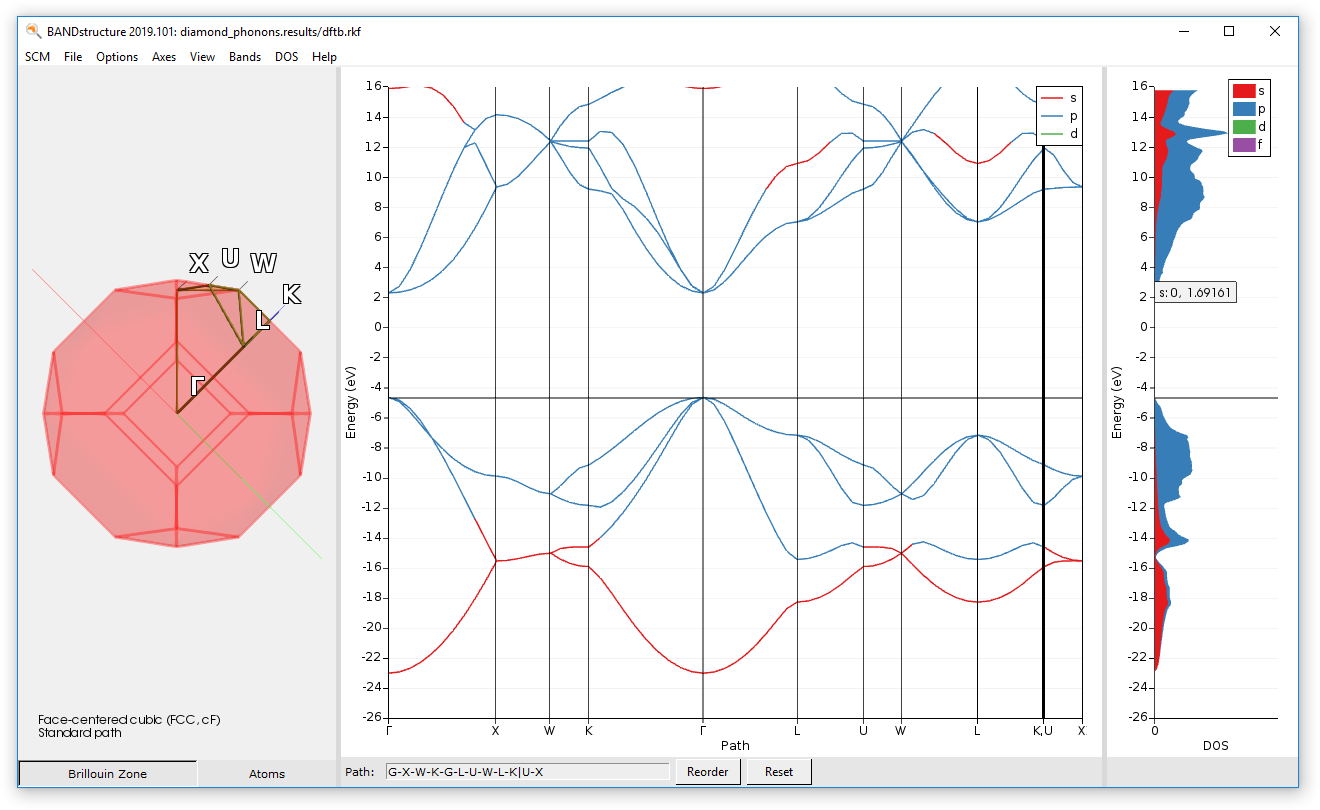
You can also visualize the electronic band structure and density of states computed by DFTB:
- In the BandStructure module, click on Options → BandStructure
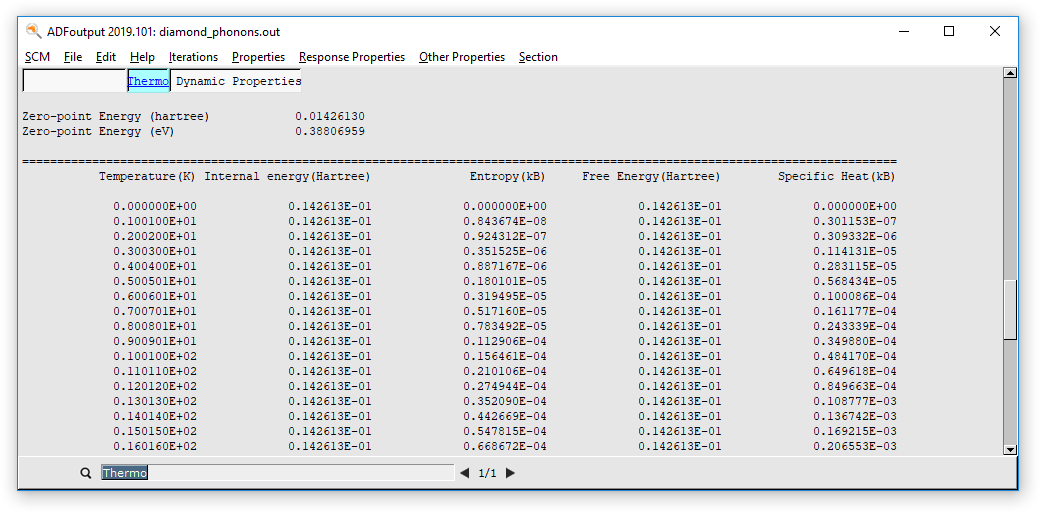
Thermodynamic properties derived from the phonon calculation are printed to the output file. To open the output file:
- In ADFJobs, right-click on your job and select OutputIn ADFOutput, search for “Thermo”