
Single Molecule Force Spectroscopy of Biomimetic Mechanotransduction
Select protein systems are able to exhibit mechanical hardening under the application of tensile stress. The synthetic reproduction of this behavior in macromolecular materials provides a unique challenge in the design of molecular structures due to the intrinsic tendency of chemical bonds to weaken in response to strain.
Covalent catch bonding represents one such class of structures, where intramolecular reorganization involves internal folding around highly-coordinated centra. The application of mechanical stress inhibits the structural change required for the interaction between ligands, raising the reaction barrier for molecular stretching. These compact catch bonds can be embedded into polymeric systems to extend the mechanotransductive behavior to the material scale, opening up novel opportunities for mechanotransductive actuators and sensors.
In this tutorial, we will highlight one such system based on a phosphate triester catch bonding unit.[1] We show how to analyze the mechanical response of the covalent catch mechanism, focusing on a polymer chain linker unit, in line with single molecule force microscopy. Modeling of these catch bond mechanisms aids in the design of new mechanotransductive materials as it allows for predictive chemical tuning of the mechanical response through modification of the molecular unit structure.
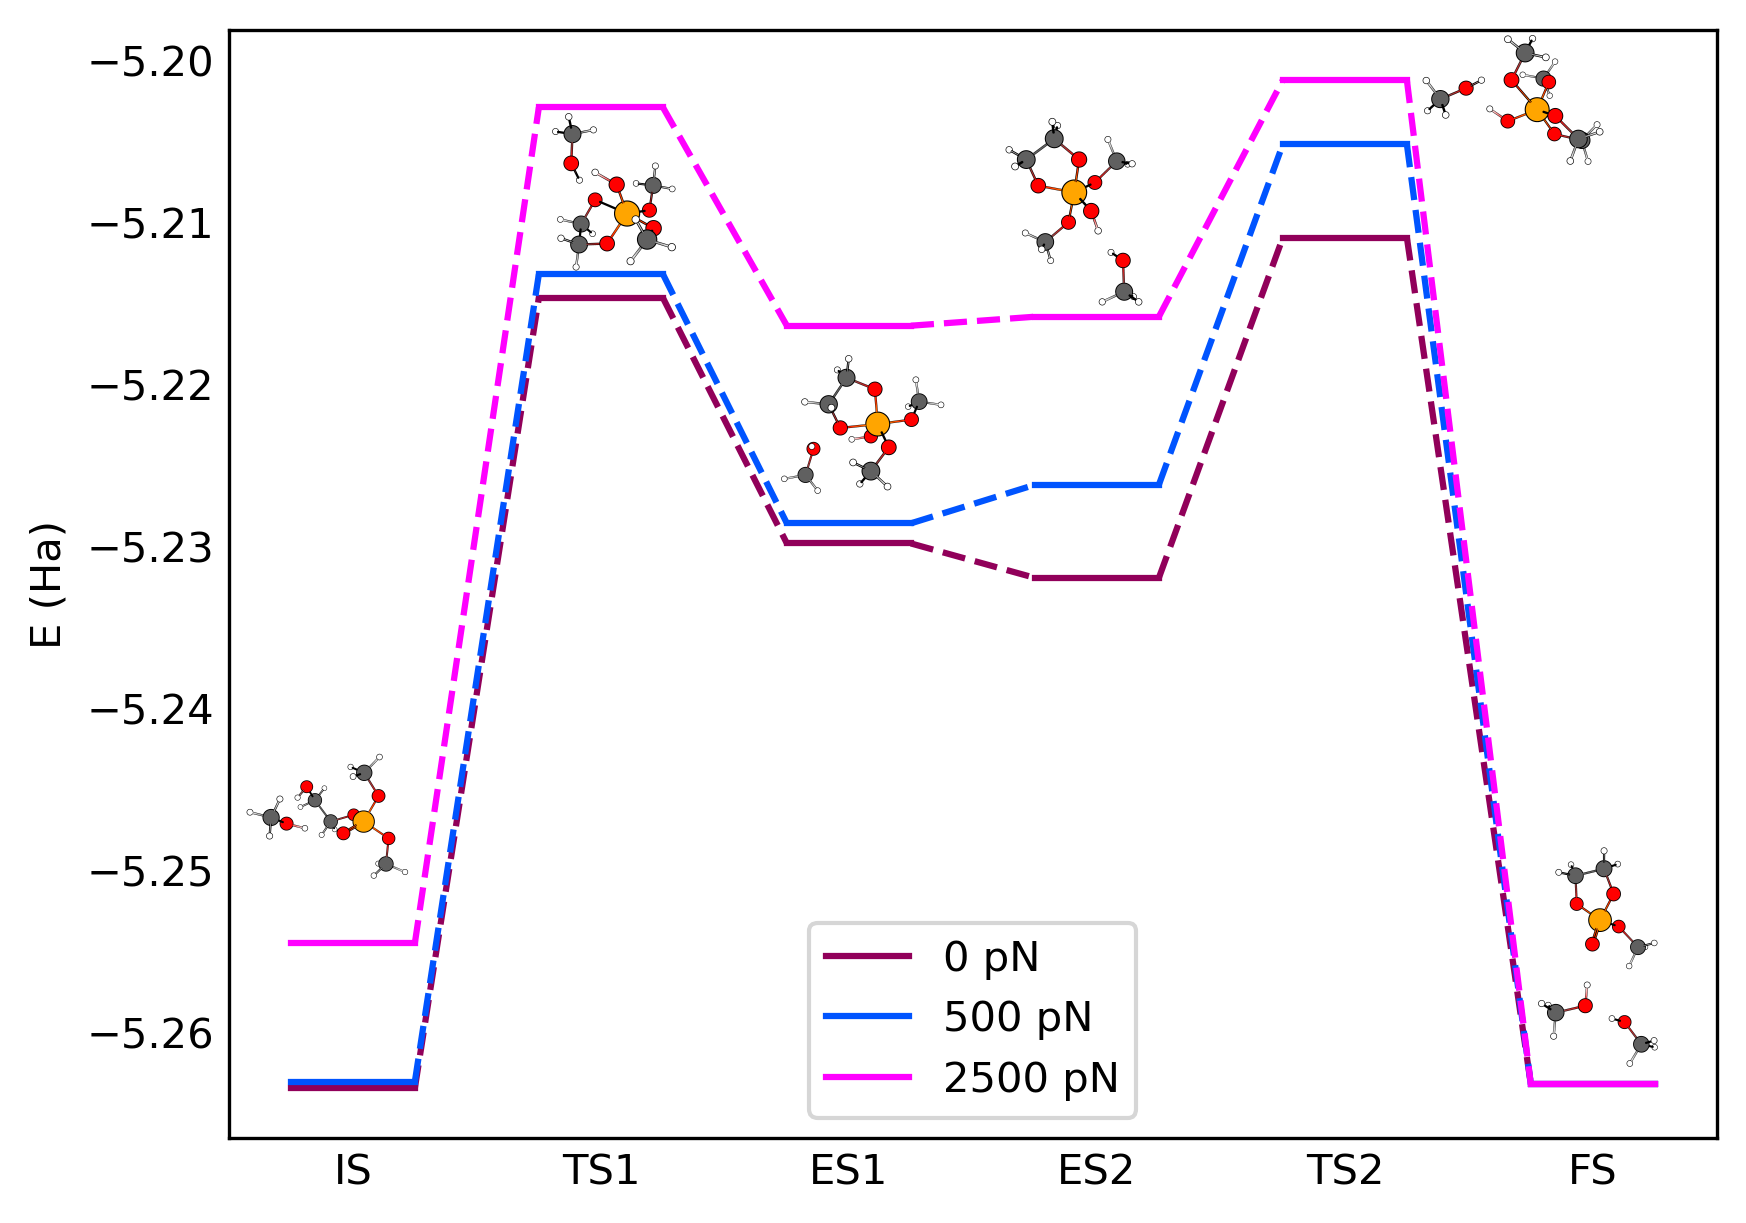
Fig. 1 Reaction energy landscape of a phosphate triester catch bond release mechanism
Reaction Mechanism
As a first step, we will determine the reaction mechanism of the catch bond unit in the absence of any applied force.
We will use a single molecular unit for these calculations, as the covalent catch bonding process is strongly localized. A methanol unit is added to the reaction complex in order to model the interaction with neighboring chains.
The catch bonding is proposed to follow an adduction-elimination reaction for the ring-closure of the hydroxyethanol group. Both adduction and elimination reactions will be modeled separately. Input geometries for the initial and final states of these reactions have been prepared using AMSinput:
Initial state for adduction (
IS)Final state for adduction (
ES1)Initial state for elimination (
ES2)Final state for elimination (
FS)
The intermediate complexes ES1 and ES2 are connected by a change in hydrogen bonding coordination with the methanol side unit. This yields a very shallow potential energy surface, for which we do not need to explicitly calculate a transition state.
To determine the energy barrier for the adduction and elimination reactions, we will need to perform a transition state search. The input for these transition state calculations will require us to first optimize the structures:
IS.ams fileGO_ISWe can reuse these settings for the other structures:
ES1.ams file. Create a new job using File → Save as with the name GO_ES1 and start the simulation using File → RunES2.ams file. Create a new job using File → Save as with the name GO_ES2 and start the simulation using File → RunFS.ams file. Create a new job using File → Save as with the name GO_FS and start the simulation using File → Run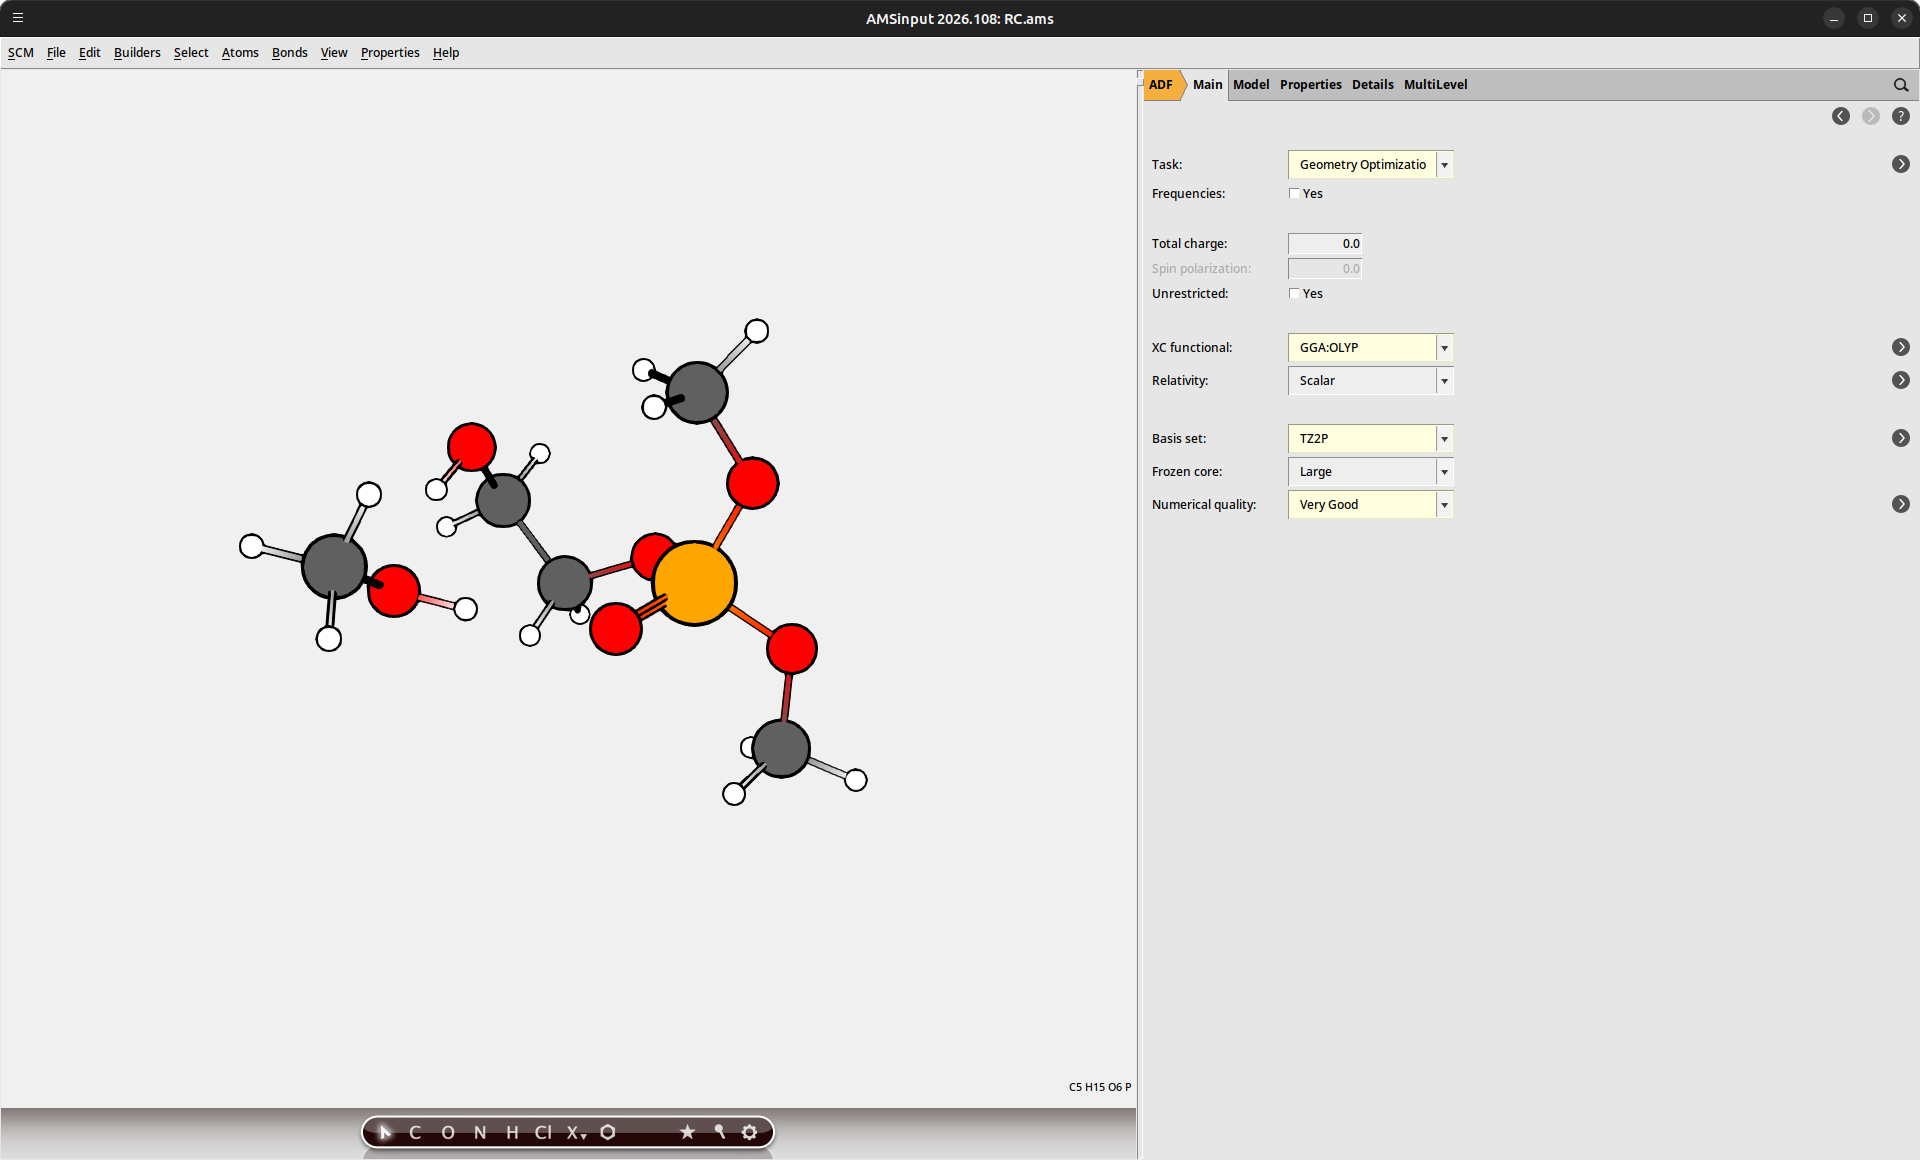
Once these calculations have completed, we can set up the transition state searches:
GO_IS.ams file to load the optimized geometryGO_ES1.ams fileNEB_IS_ES1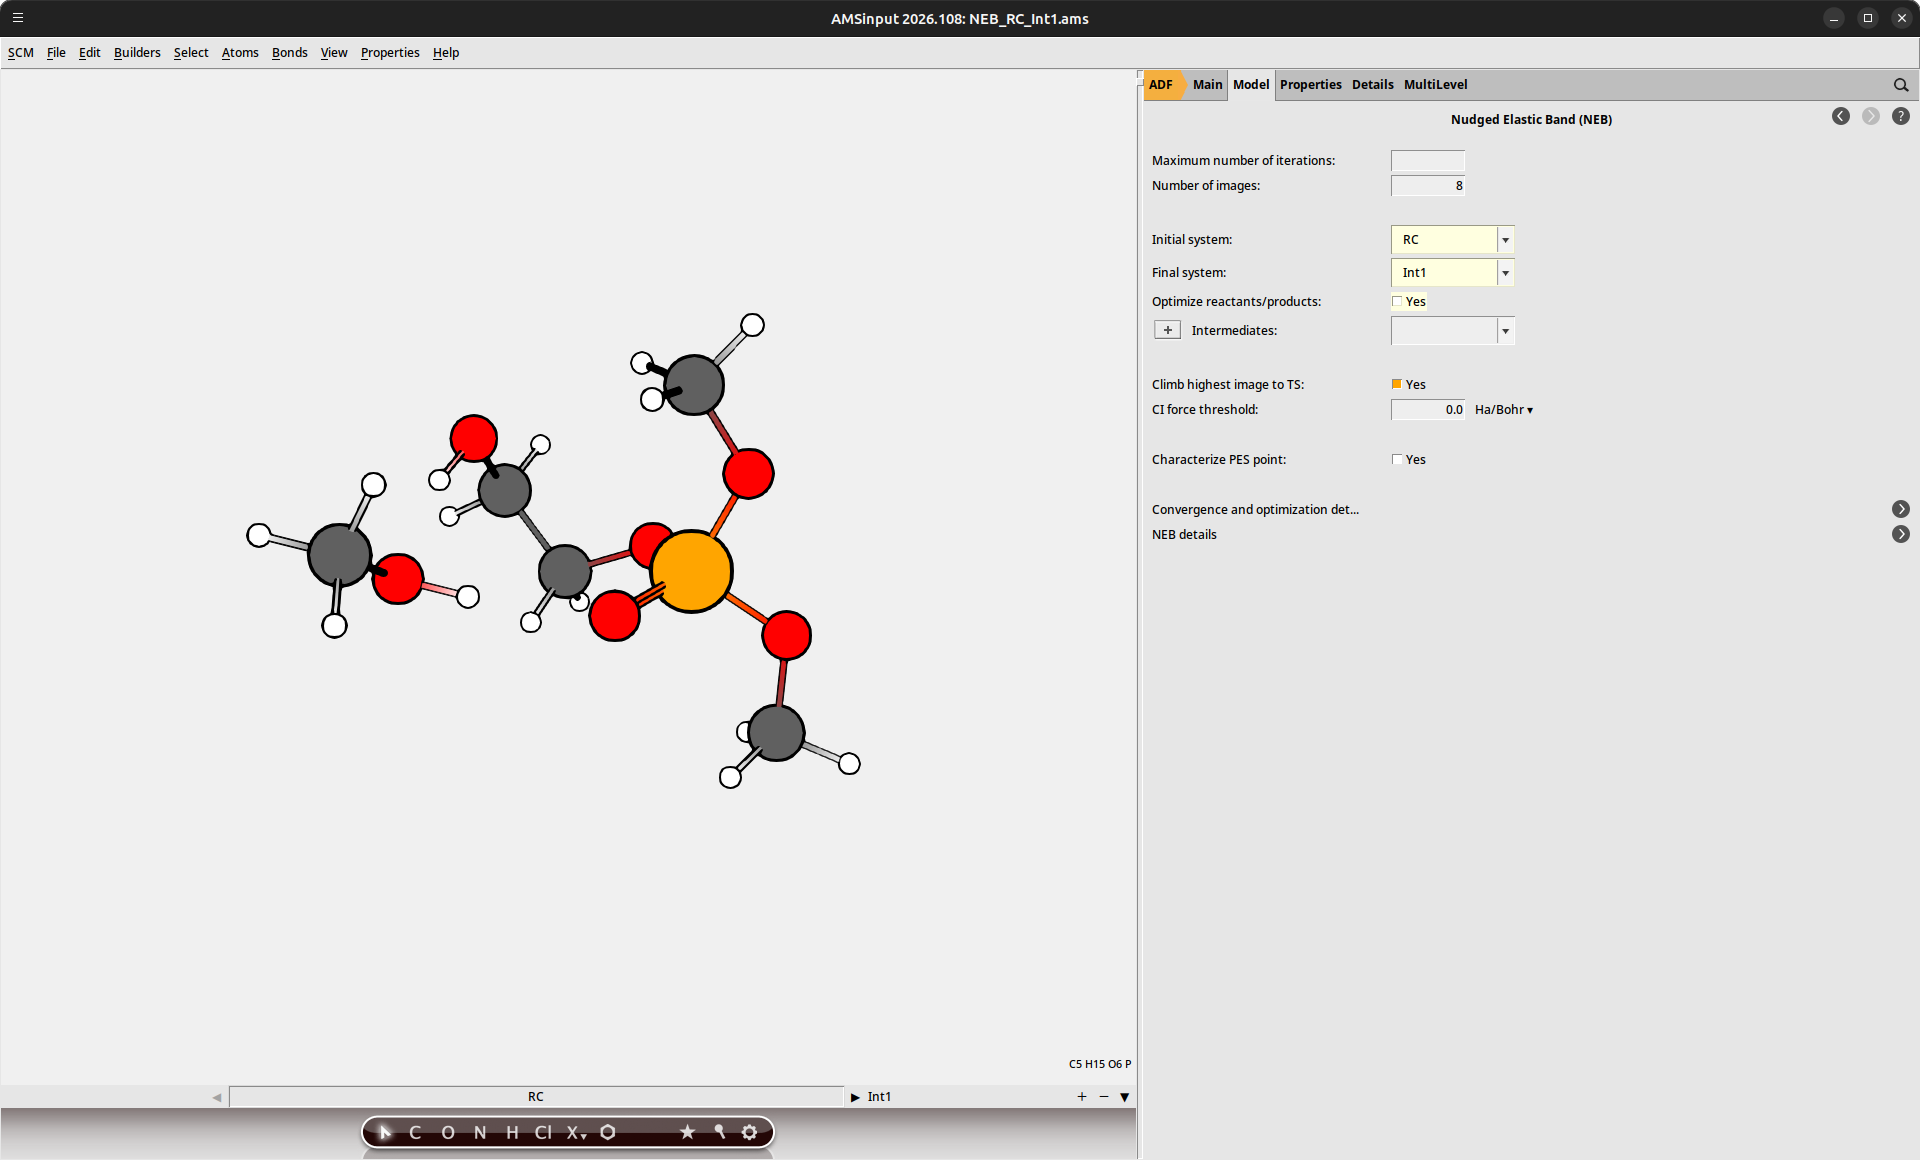
And similarly for the elimination reaction:
GO_FS.ams fileGO_ES2.ams fileNEB_FS_ES2Note
The provided structures for IS, ES1, ES2 and FS use the same atom order. (As seen in the Model → Coordinates panel.) This is required for the NEB interpolation to yield the correct intermediate structures.
Once the NEB calculation has finished, we can visualize the potential energy surface connecting the initial and final states using AMSmovie:
NEB_IS_ES1 job and use SCM → Movie to analyze the results with AMSmovie. The energy landscape will be shown automatically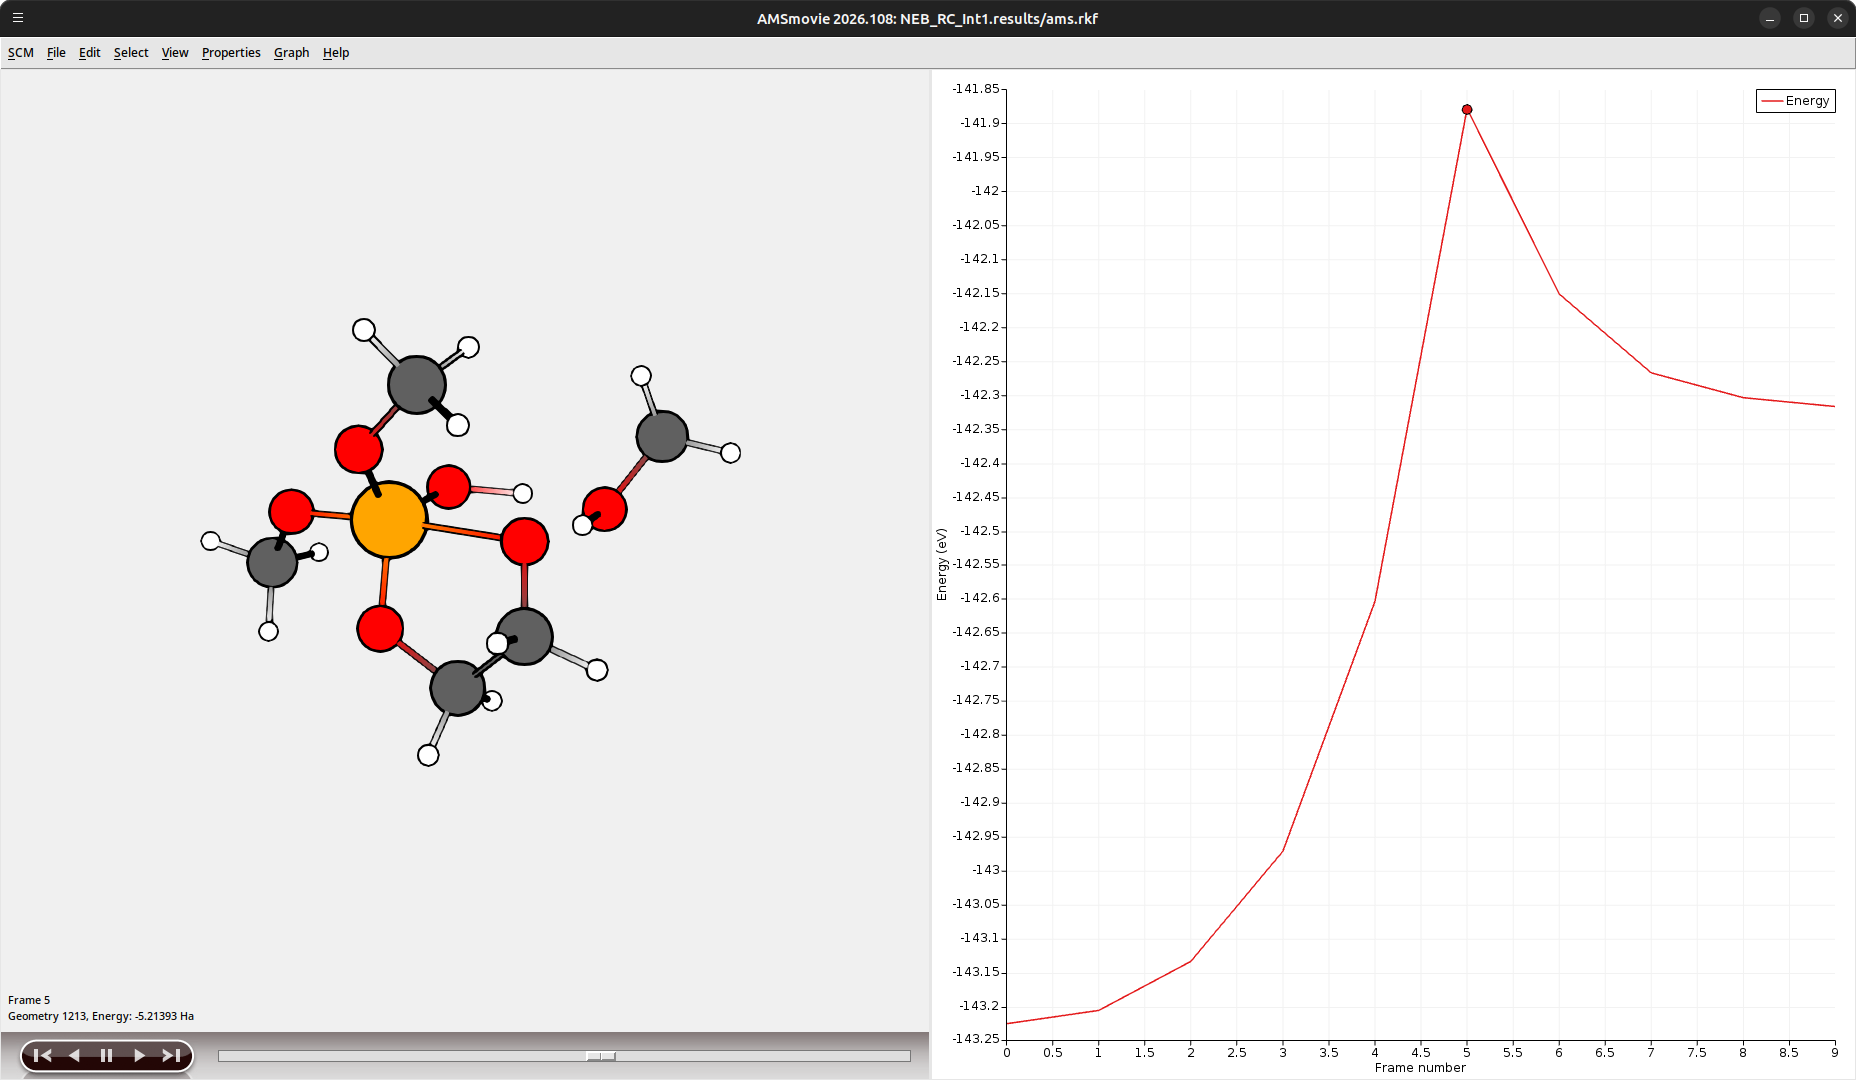
Fig. 2 Reaction coordinate between IS and ES1 obtained using CI-NEB
To guarantee proper convergence of the transition states, we will perform a final transition state optimization.
GO_IS.ams file to load the previous settingsGO_TS1GO_TS2 from NEB_FS_ES2With the transition state optimizations completed, we have access to the energy levels of each state in the reaction mechanism.
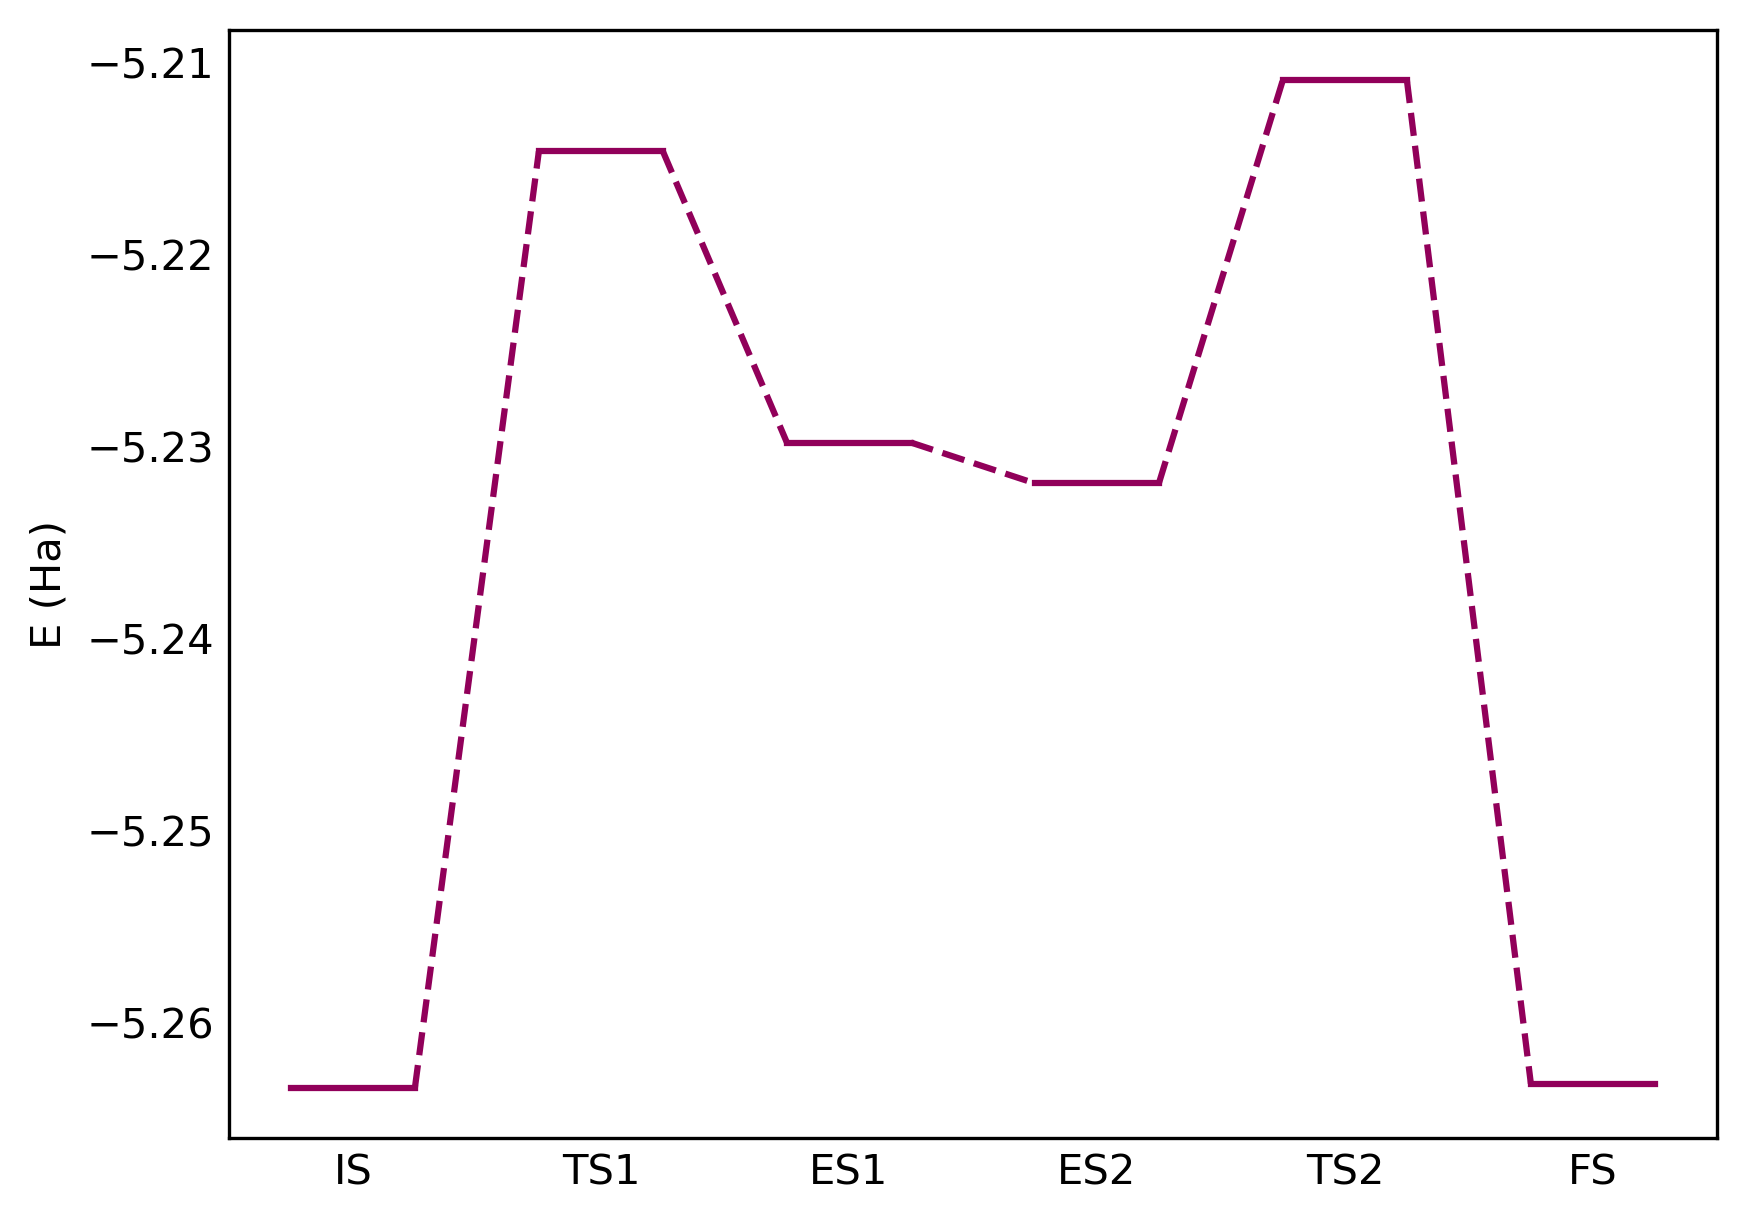
Fig. 3 Reaction energy diagram for the phosphate triester ring closure
The dominant reaction barrier is the initial addition of the hydroxyethanol group (TS1), as a result of the steric crowding around the phosphor center. Once the initial state (ES1) is formed, the barriers for both TS1 and TS2 elimination pathways are similar, suggesting that part of the intermediates will fall back to the initial state (IS). The barrier for the inverse ring-opening reaction from the final state (FS) through TS2 has a comparable energy barrier to the hydroxyethanol addition, indicating that the transductive process is reversible.
Force Application
We can analyze how the reaction energy landscape changes when force is applied to stretch the phosphate unit. (Corresponding to the application of shear or tensile stresses when included in a larger polymer material.)
We will use the AMS Restraints module to configure a pulling force on the chain connections of our covalent linker. The error function restraint is used with a negative bias in order to simulate a constant force.
GO_IS.ams file to load the optimized geometry icon to set up a new restraint
100pN_IS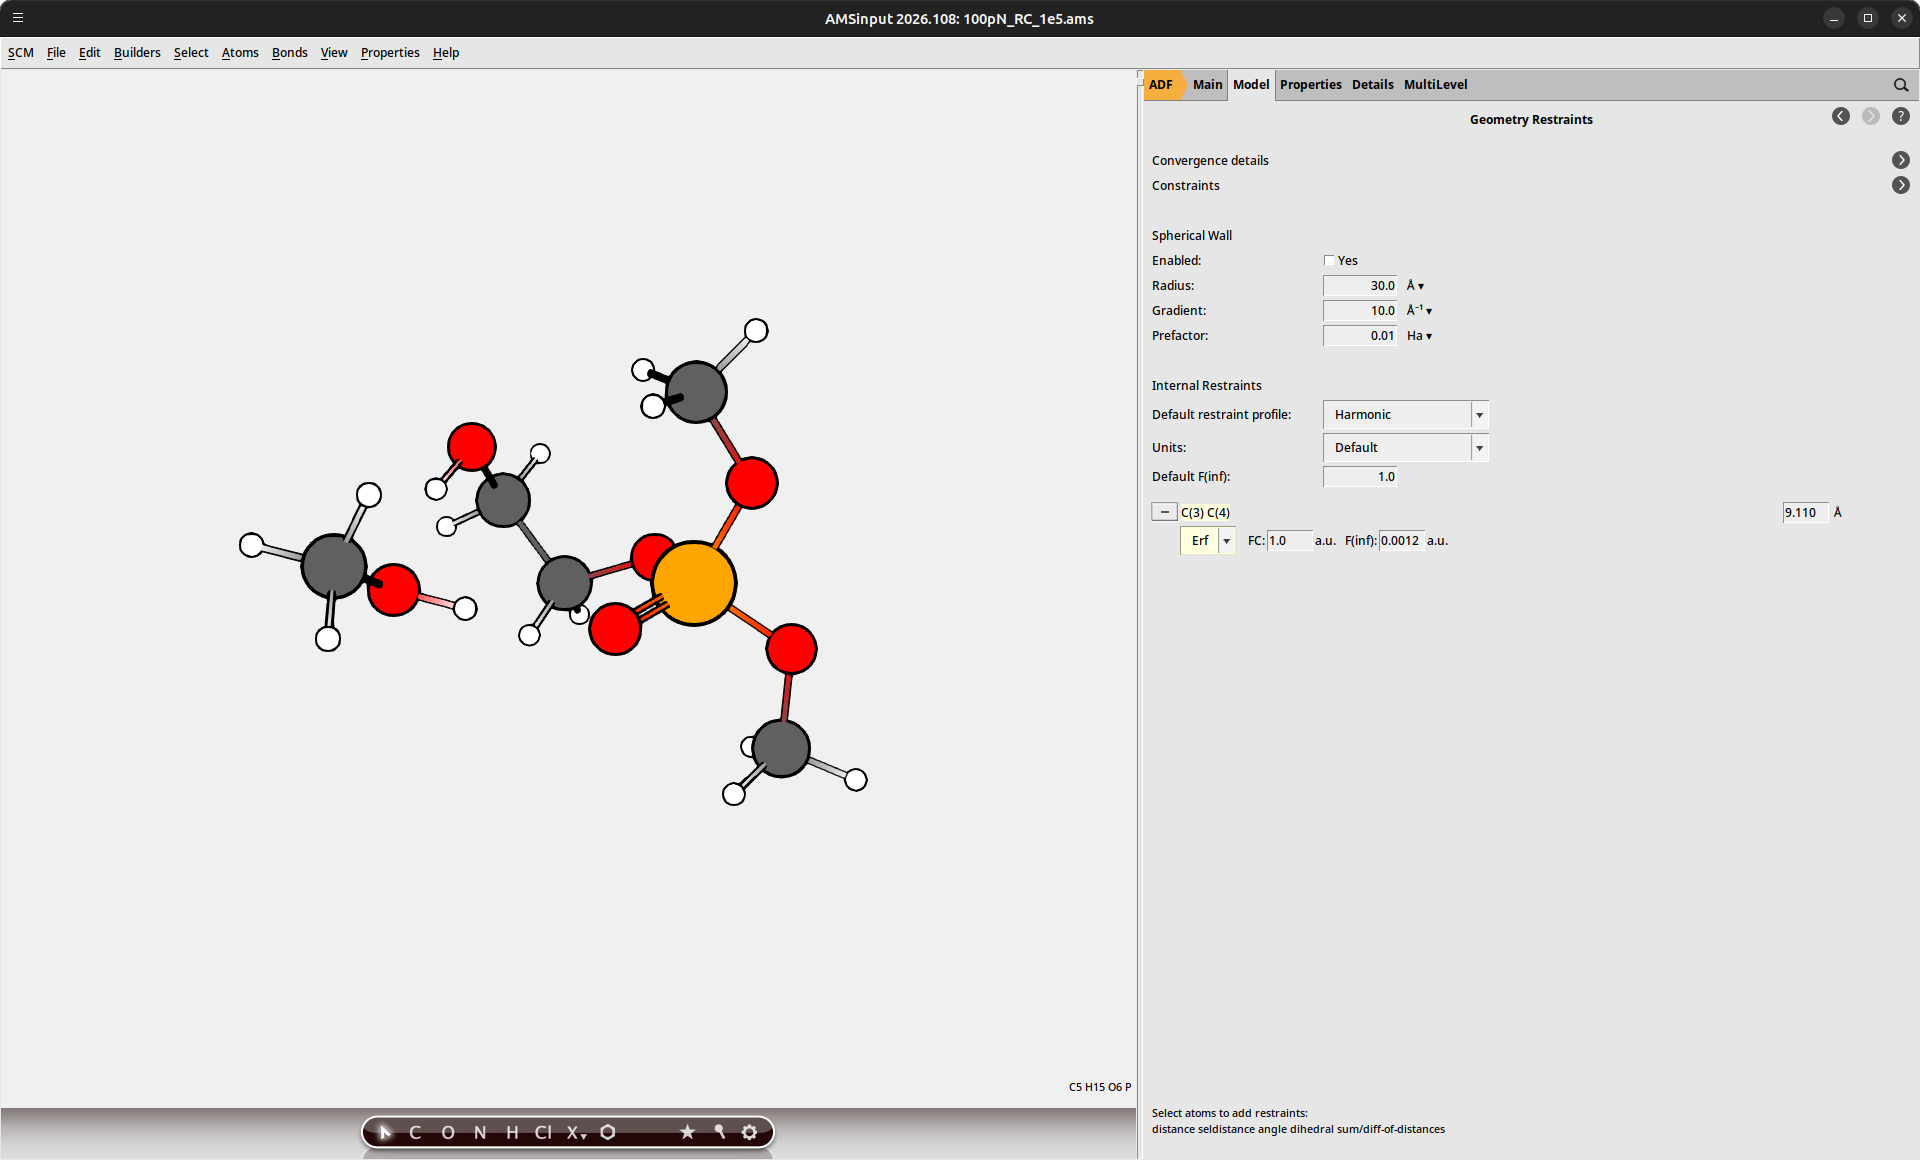
The geometry optimization will find a new equilibrium structure under application of this external force. This calculation can be performed for each of the states in our reaction energy diagram to compute the overall shift. Because the elimination reaction decouples the terminal methyl anchor points, we may skip the applied-force calculations for the FS state (since the catch bond has already been broken).
Note
Make sure that the Task is set to Transition state search for the force-biased calculations of TS1 and TS2. If you load the calculation results from GO_TS1 or GO_TS2, then these settings will already be configured correctly.
The applied-force calculations can be repeated at different levels of force to monitor the energy shifts at increasing strain. It is recommended to perform this procedure using small increments of the applied force, using the previous structure as the starting point for the optimization. Particularly for the transition states, the external force can destabilize the structure, preventing a (meta-)stable state from being found.
100pN_IS.ams file to load the optimized structure at a pulling force of 100 pN200pN_ISThis procedure is repeated in 100 pN increments up to a total force of 2900 pN. At 3000 pN force, the transition states are no longer meta-stable, as we are entering a regime where irreversible bond cleavage can occur.
Analysis
The change in the energy levels with increasing force application is shown in the figure below.
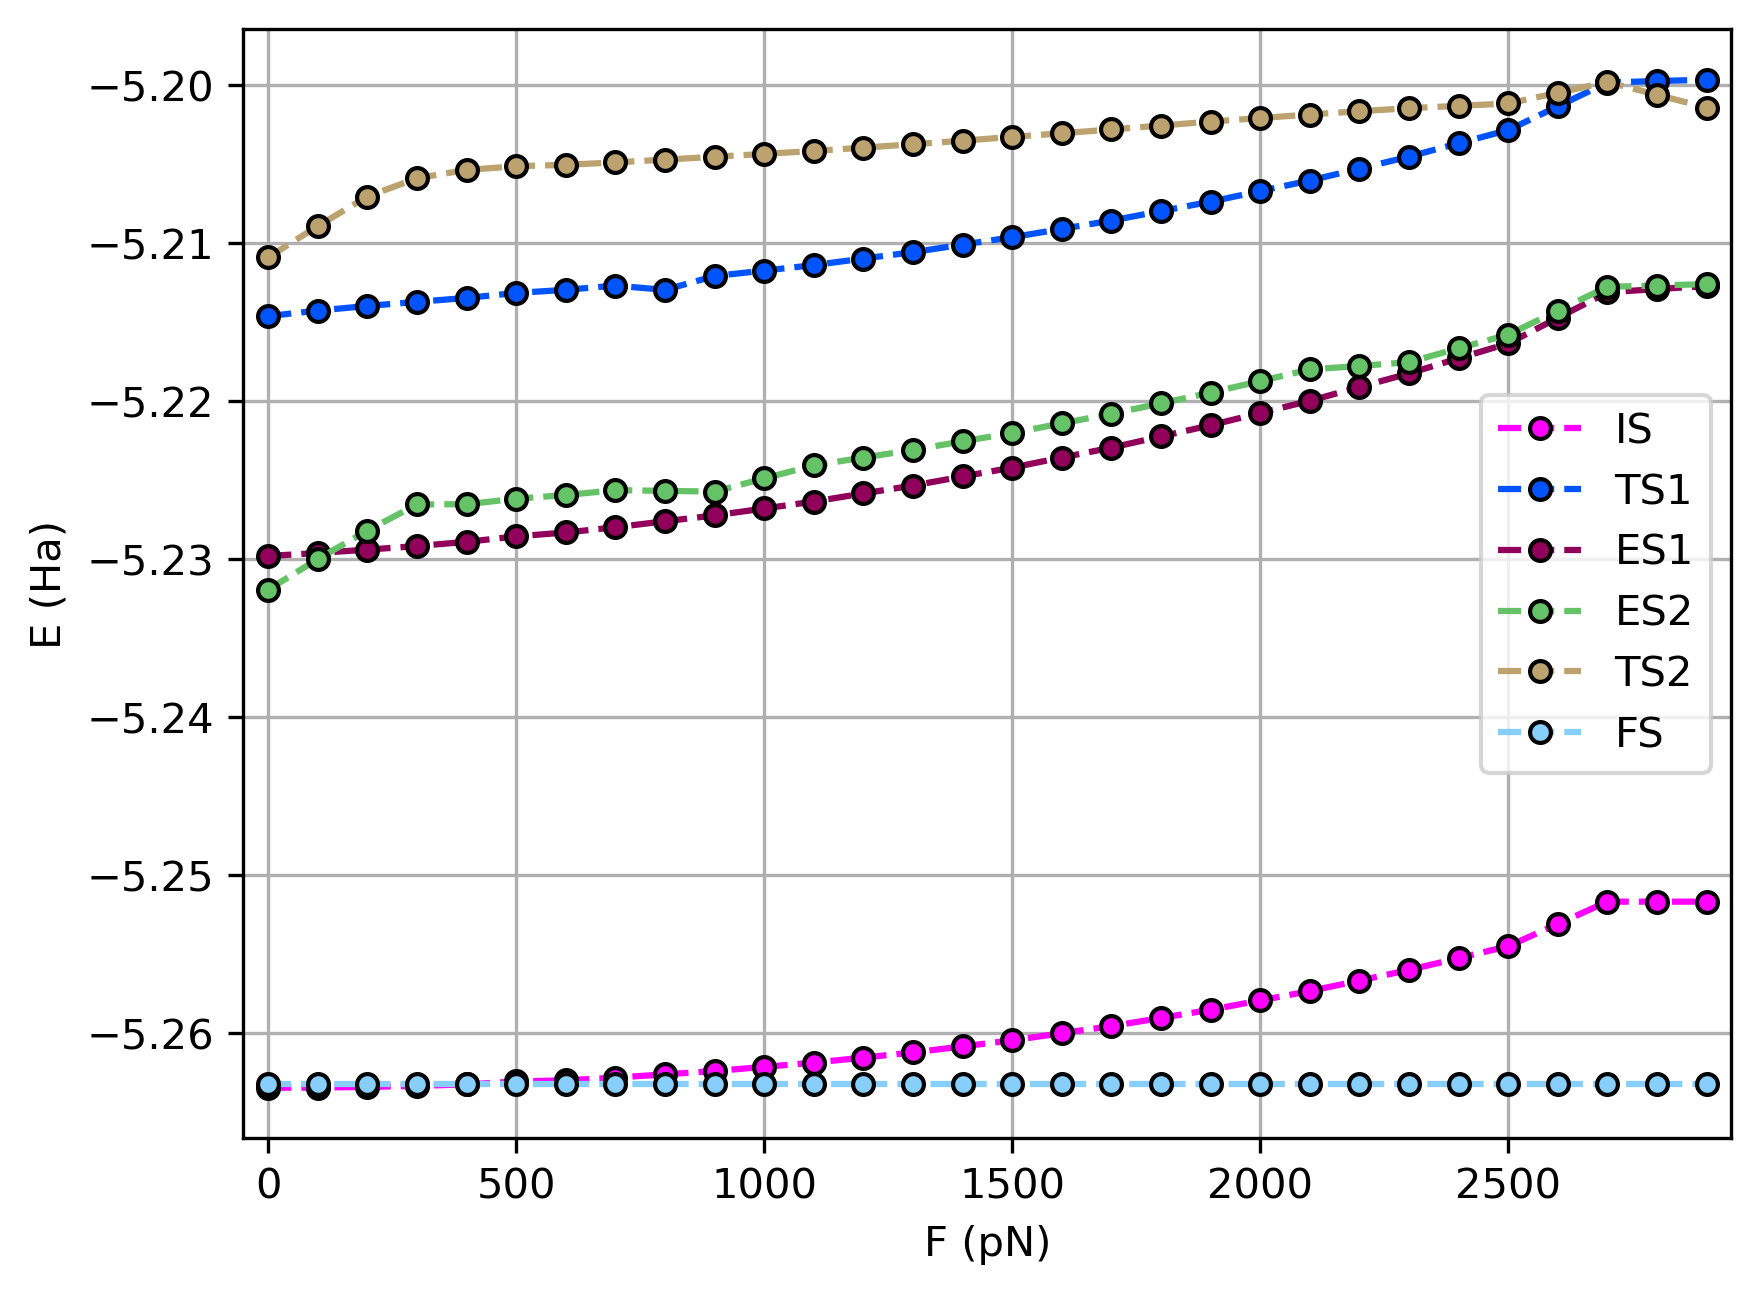
Fig. 4 Change in the phosphate complex energies with applied force
The energy for each of the states is seen to increase gradually as the complex is pulled away from the stable equilibrium position. At a low pulling force, this effect is most notable for the ES2 and TS2 complexes, as hydrogen bonding with the displaced methanol anchor contributes to the stabilization in these states.
The effect of the energy shifts on the reaction energetics can be seen by comparing the reaction barriers, shown in the figure below.
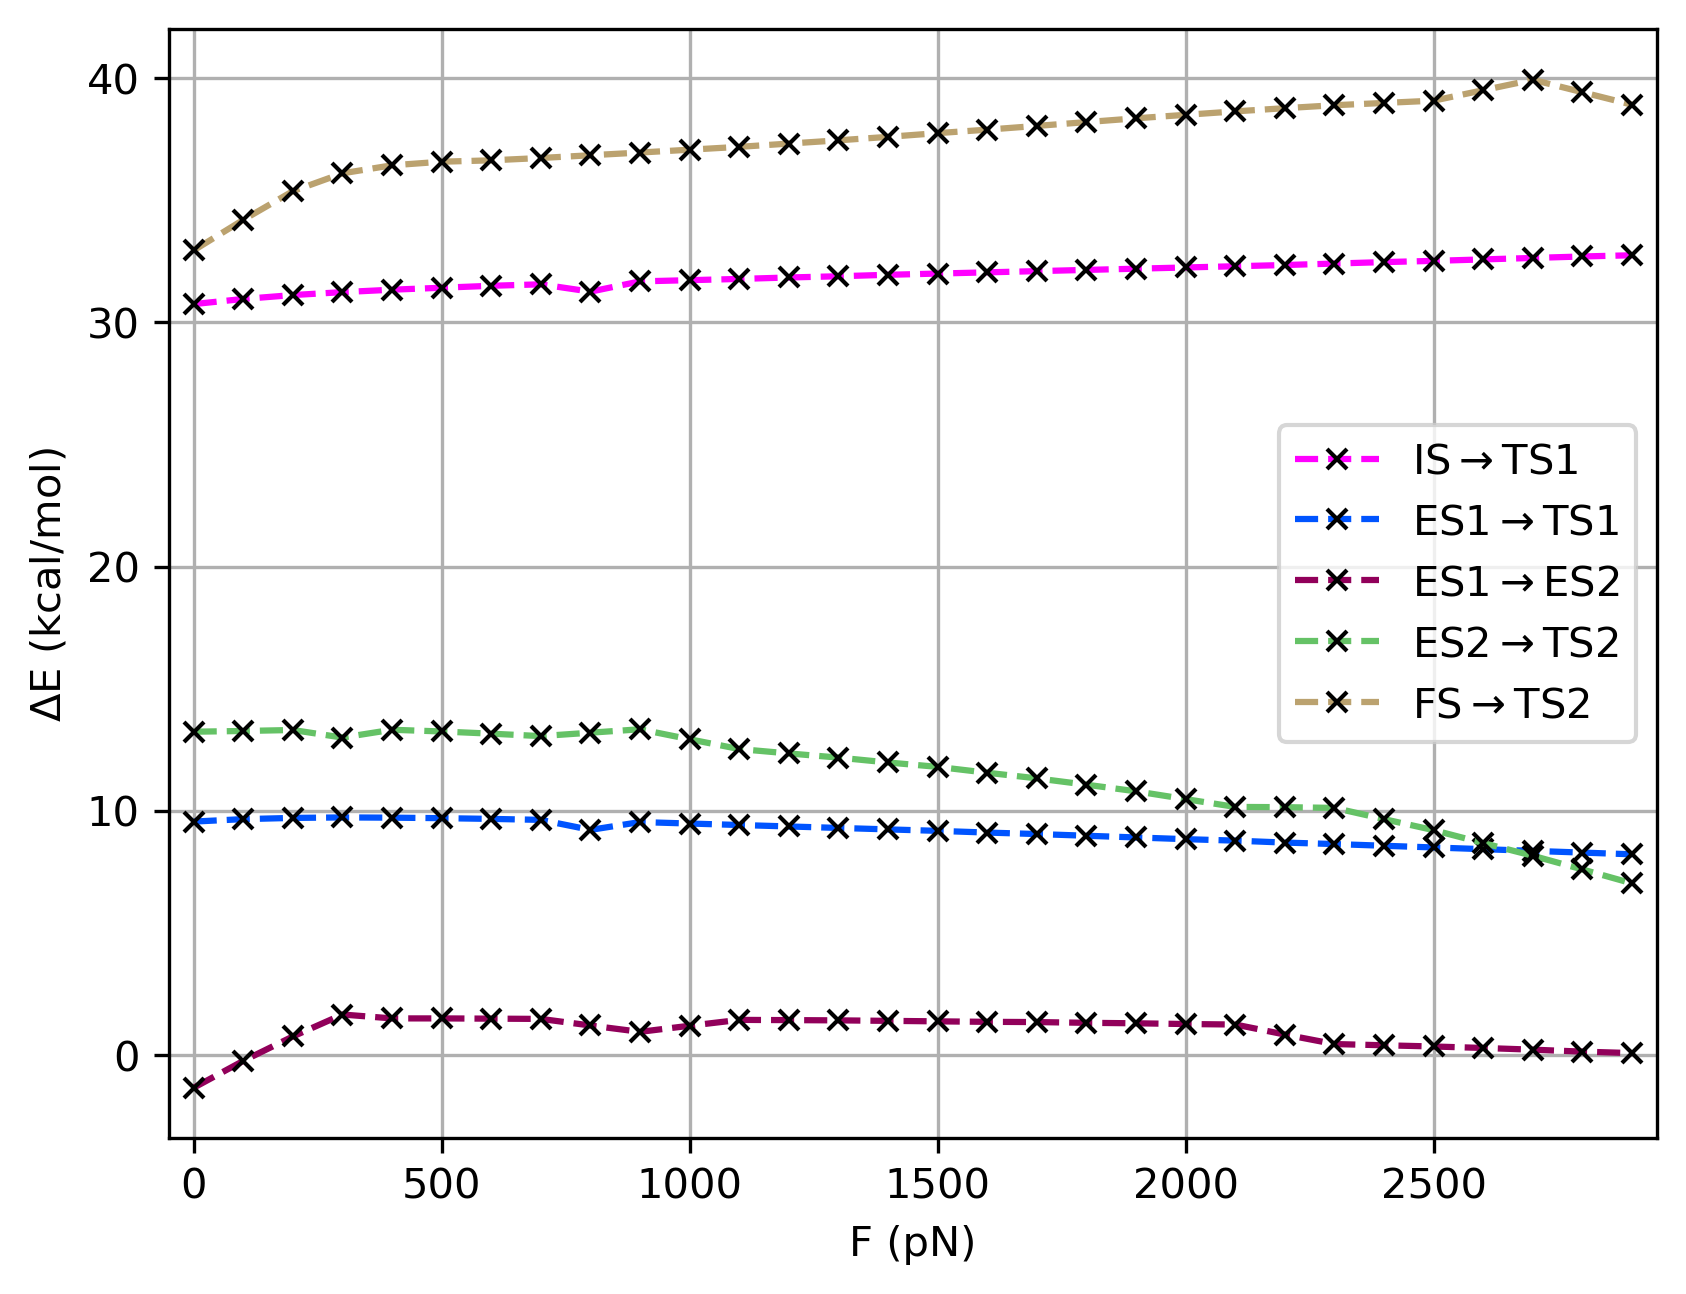
Fig. 5 Change in reaction barriers with applied force
When the force increases up to 400 pN, we see that the ES2 level moves above the ES1 state. This suggests that a higher fraction of molecules will fall back to the IS after the initial adduction step. As a result, more energy is required to disconnect the chain ends. This is reflected in single molecule force microscopy measurements, as an increase in polymer lifetime is observed with increasing force.[1] After 400 pN, the effect levels off as the ES1/ES2 barrier stabilizes.
At very high force application above 2600 pN, the barrier for the elimination reaction drops below the barrier for the reverse adduction process. Under these extreme conditions, ES intermediates can be expected to predominantly undergo elimination, resulting in catch bond release. However, the high barrier for the initial adduction makes it more likely that the high force would instead lead to backbone cleavage when incorporating the linker inside a polymer framework.
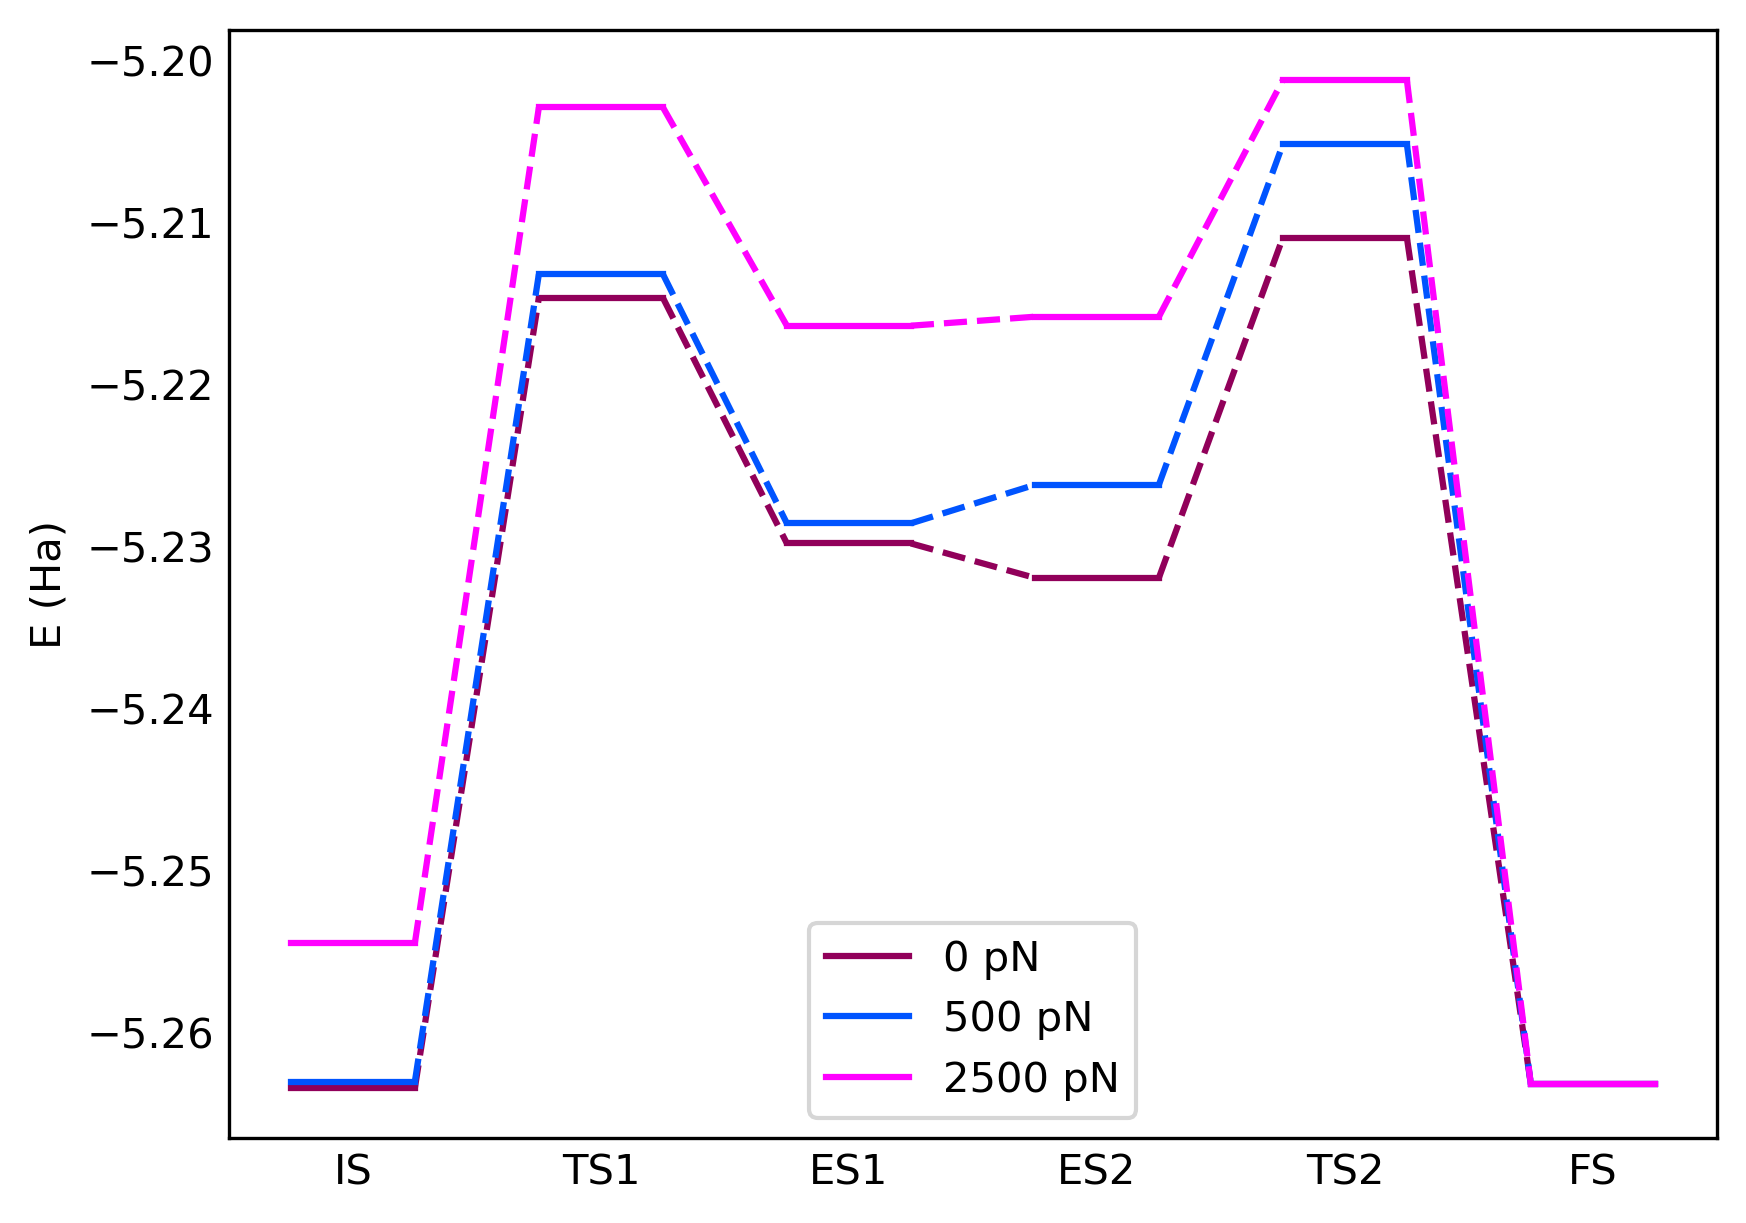
Fig. 6 Reaction energy diagram for the phosphate triester ring closure under a constant external pulling force
Note
In this analysis, we have made comparisons between reaction energies. A full kinetic analysis would require consideration of the zero-point energies and the partition factors. Given that our current example concerns an intramolecular reorganization, we can expect the ZPE differences to be relatively minor, hence why they were omitted from the present analysis.
See also
The reaction energies can be used as input for a microkinetic simulation to determine the influence of the applied force on the catch bond release, allowing prediction of SMFS lifetimes.